 21
21peptides
spectra
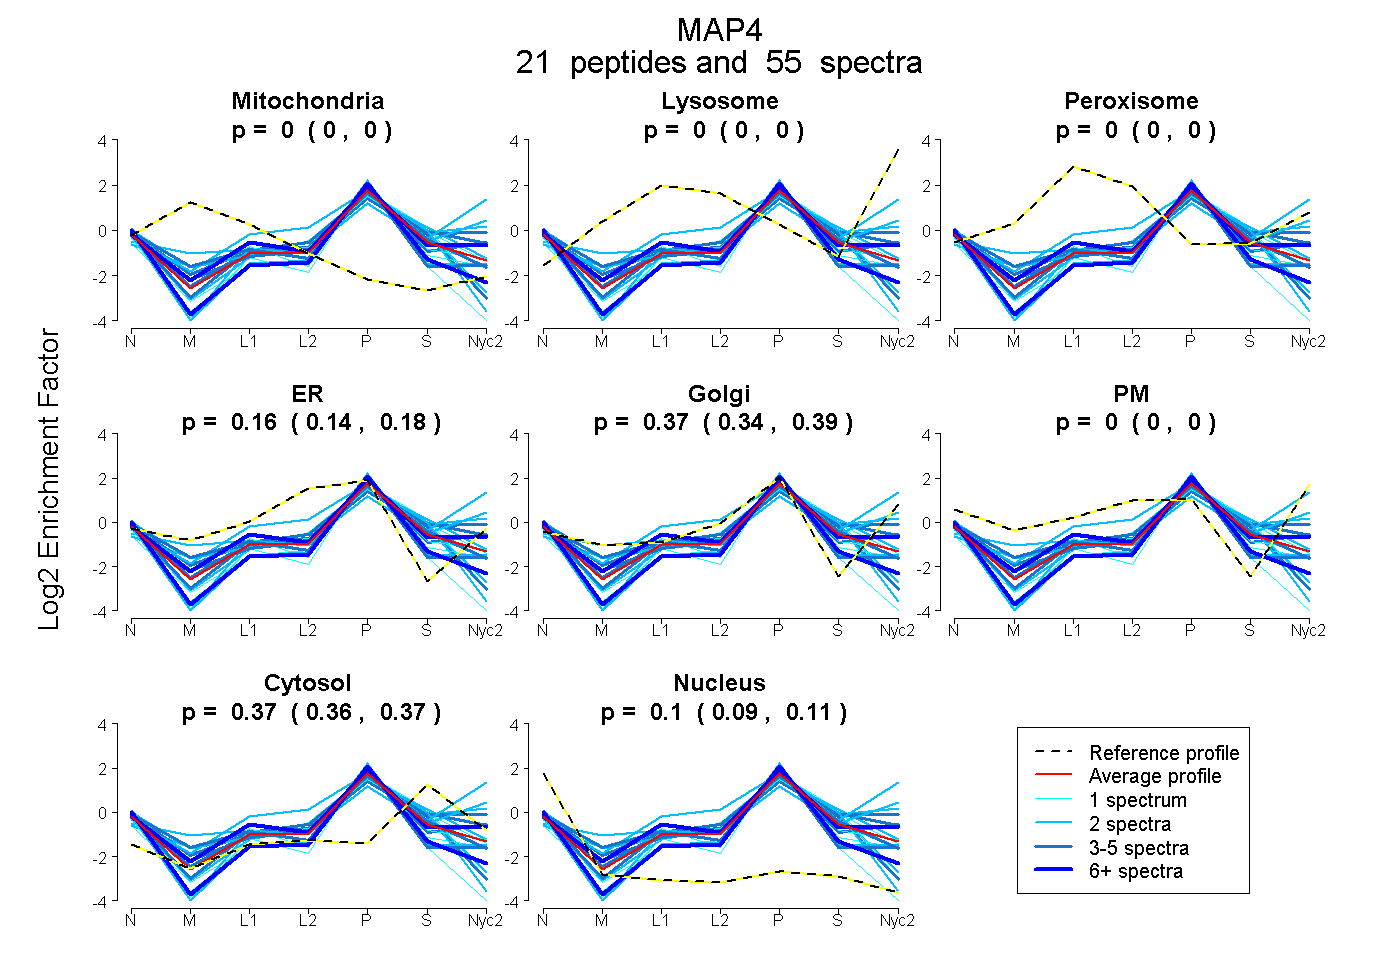
0.000 | 0.000
0.000 | 0.000
0.000 | 0.000
0.141 | 0.181
0.341 | 0.392
0.000 | 0.000
0.360 | 0.371
0.095 | 0.107
8peptides
spectra
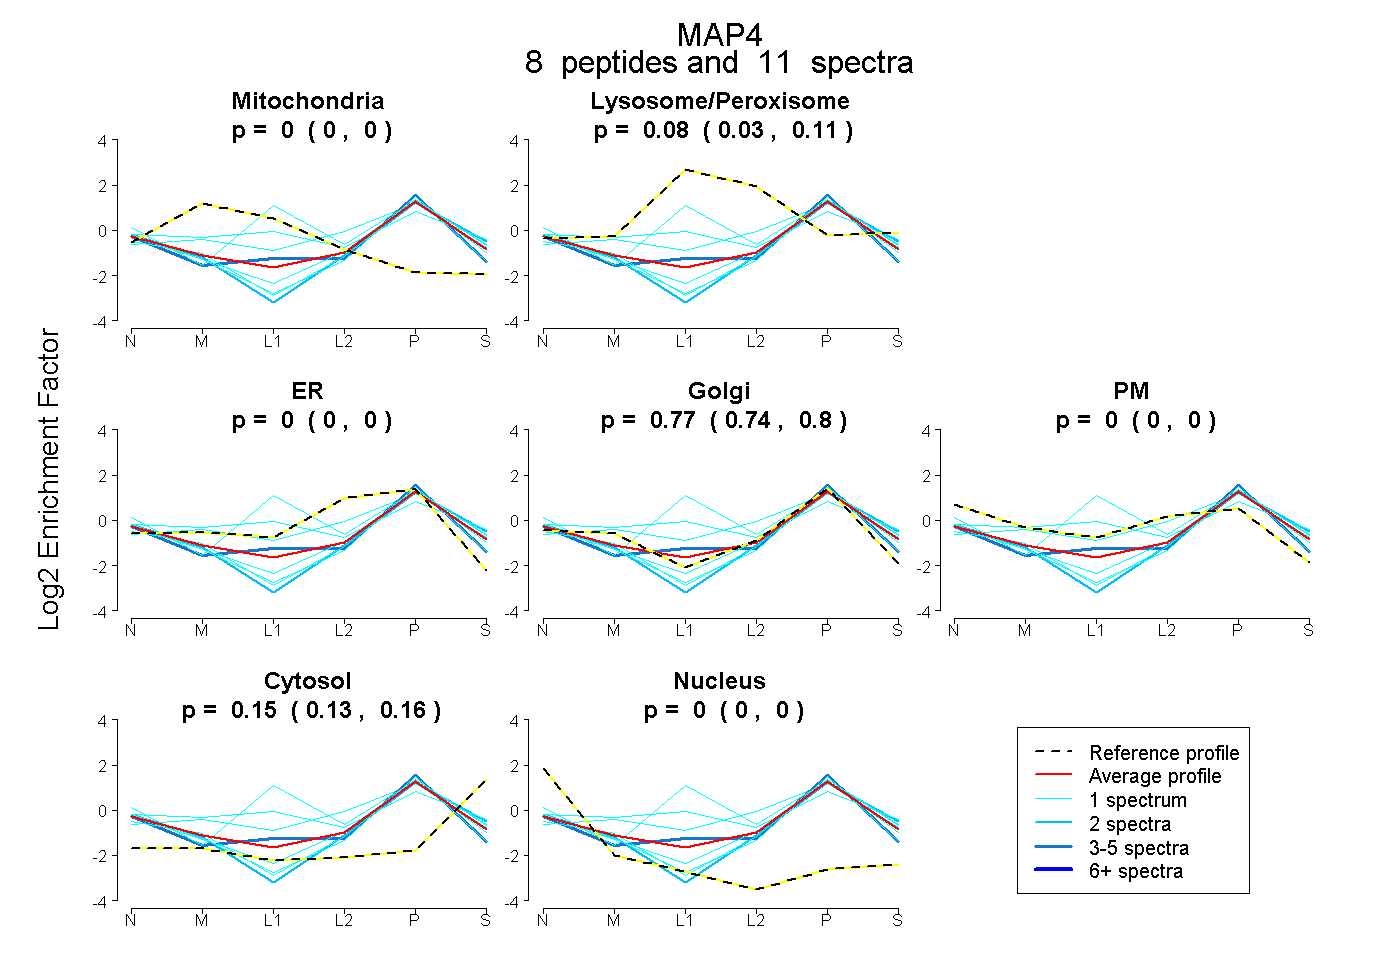
0.000 | 0.000
0.035 | 0.113
0.000 | 0.000
0.745 | 0.800
0.000 | 0.000
0.127 | 0.164
0.000 | 0.000
13peptides
spectra
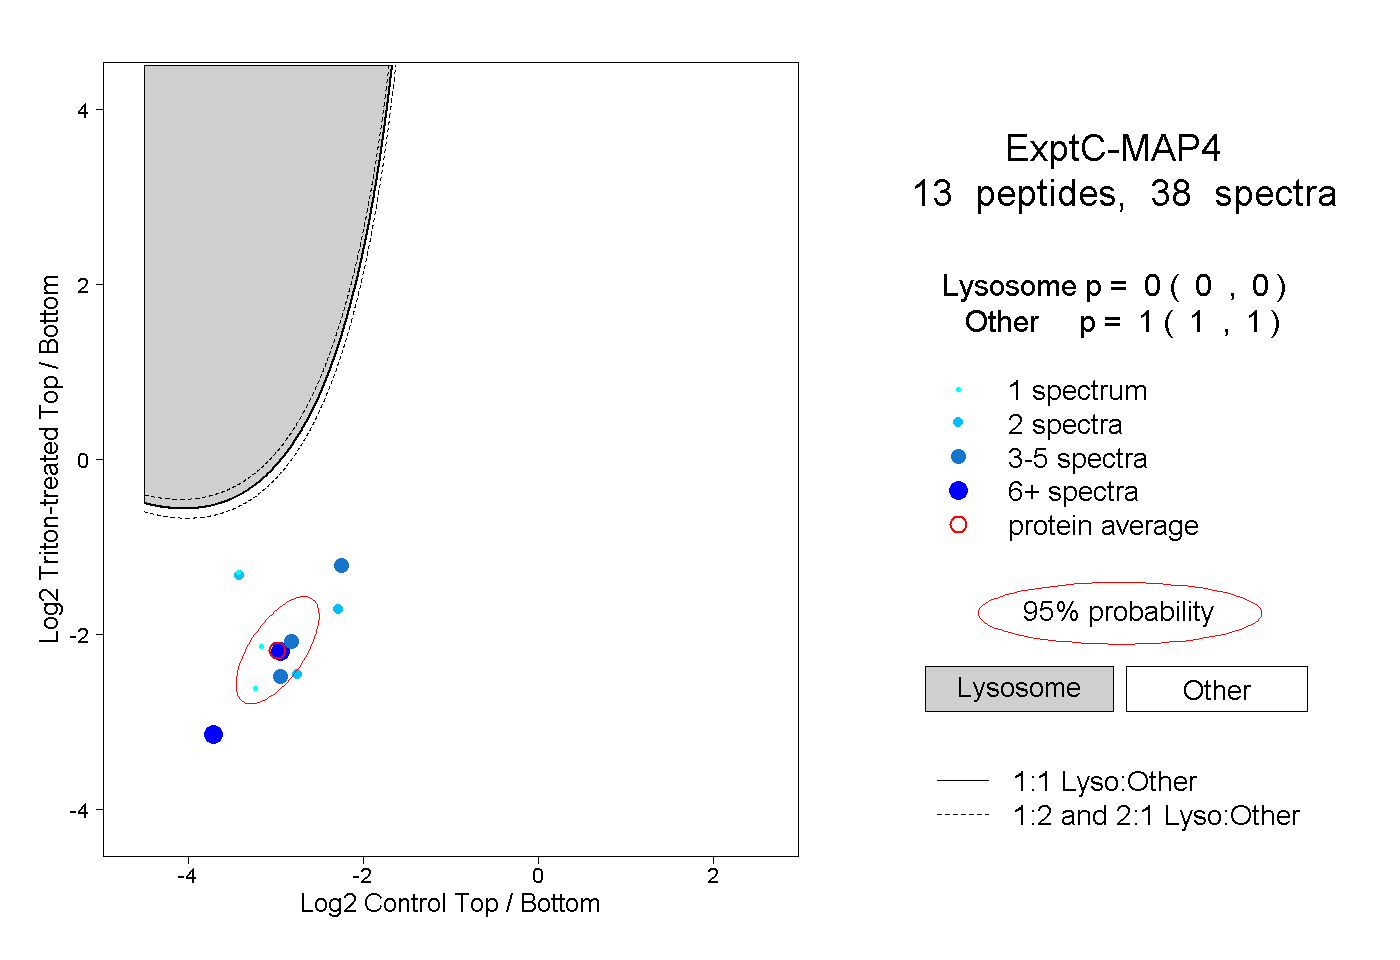
0.000 | 0.000
1.000 | 1.000
5peptides
spectra
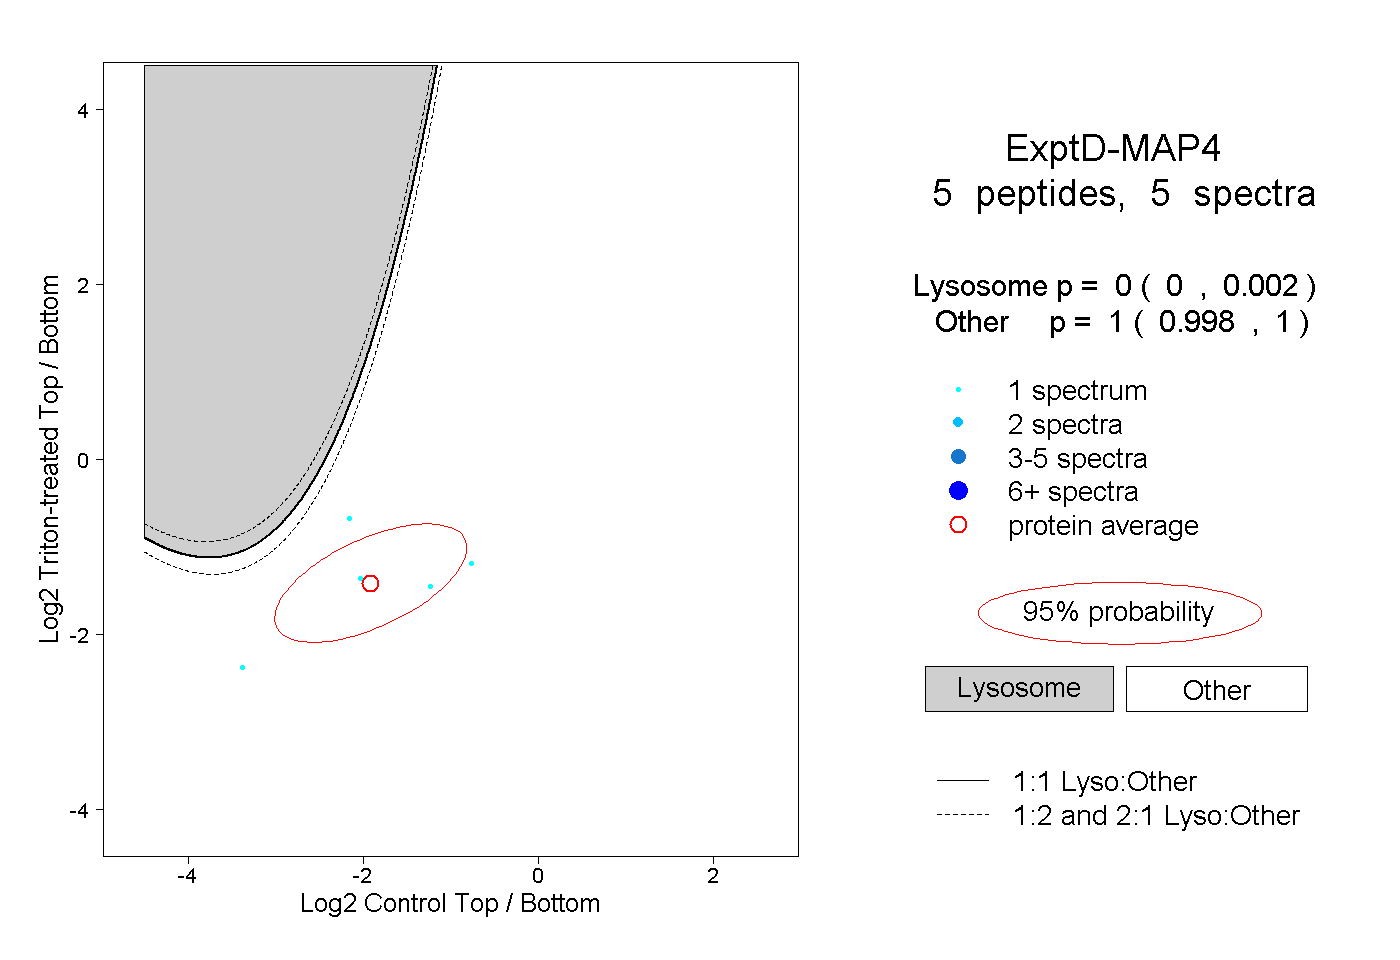
0.000 | 0.002
0.998 | 1.000