 21
21peptides
spectra
0.000 | 0.000
0.000 | 0.000
0.000 | 0.000
0.141 | 0.181
0.341 | 0.392
0.000 | 0.000
0.360 | 0.371
0.095 | 0.107
| Plot | Mito | Lyso | Perox | ER | Golgi | PM | Cytosol | Nucleus | |||||
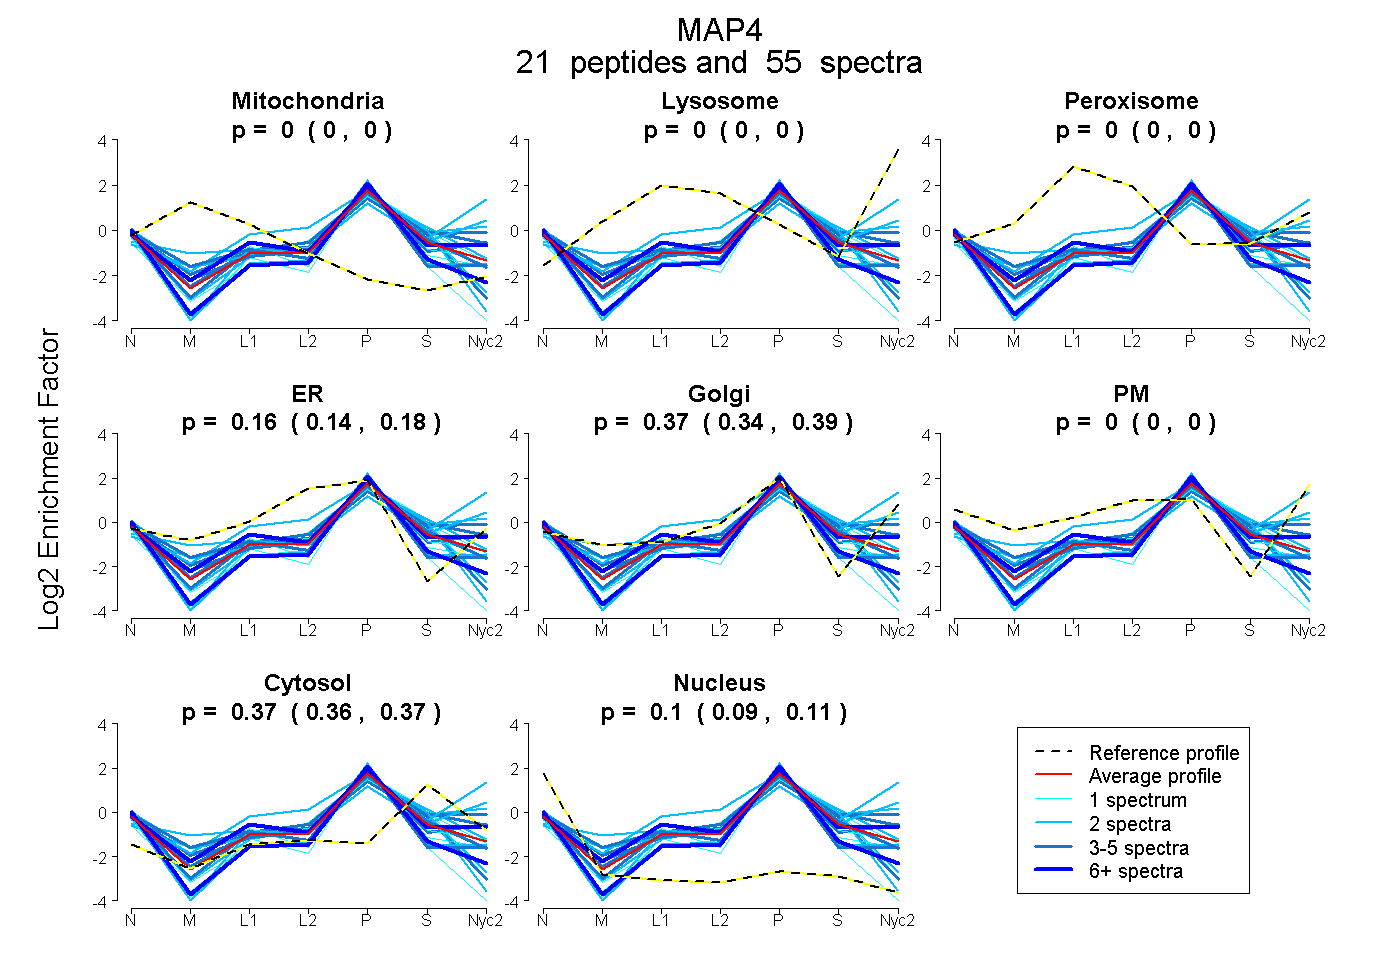
| Expt A |
21 peptides |
55 spectra |
|
0.000 0.000 | 0.000 |
0.000 0.000 | 0.000 |
0.000 0.000 | 0.000 |
0.164 0.141 | 0.181 |
0.369 0.341 | 0.392 |
0.000 0.000 | 0.000 |
0.366 0.360 | 0.371 |
0.102 0.095 | 0.107 |
| 2 spectra, STLPVDEGSPLEK | 0.000 | 0.204 | 0.000 | 0.000 | 0.564 | 0.000 | 0.233 | 0.000 | ||
| 1 spectrum, AVDLESVK | 0.000 | 0.000 | 0.000 | 0.289 | 0.000 | 0.000 | 0.521 | 0.190 | ||
| 1 spectrum, ETSGSQPPELCSGVSR | 0.000 | 0.000 | 0.000 | 0.000 | 0.602 | 0.000 | 0.398 | 0.000 | ||
| 2 spectra, DMTFPK | 0.000 | 0.000 | 0.019 | 0.000 | 0.603 | 0.000 | 0.379 | 0.000 | ||
| 4 spectra, TTSASSVK | 0.000 | 0.000 | 0.000 | 0.188 | 0.498 | 0.000 | 0.120 | 0.194 | ||
| 2 spectra, TEFIPLLDGDEK | 0.000 | 0.000 | 0.000 | 0.309 | 0.000 | 0.000 | 0.456 | 0.236 | ||
| 2 spectra, DMAPLPESEVALGK | 0.000 | 0.000 | 0.000 | 0.219 | 0.263 | 0.000 | 0.518 | 0.000 | ||
| 2 spectra, AAVGLTGNDIATPPNK | 0.000 | 0.000 | 0.000 | 0.386 | 0.000 | 0.000 | 0.441 | 0.173 | ||
| 6 spectra, VKPMSAPCR | 0.000 | 0.000 | 0.000 | 0.112 | 0.383 | 0.000 | 0.210 | 0.295 | ||
| 6 spectra, VGSTENMK | 0.000 | 0.000 | 0.000 | 0.097 | 0.536 | 0.000 | 0.337 | 0.029 | ||
| 2 spectra, TTPTISK | 0.000 | 0.000 | 0.000 | 0.000 | 0.579 | 0.000 | 0.187 | 0.234 | ||
| 5 spectra, SATADLSR | 0.000 | 0.000 | 0.000 | 0.013 | 0.640 | 0.000 | 0.275 | 0.073 | ||
| 4 spectra, EQLPAK | 0.000 | 0.000 | 0.000 | 0.000 | 0.535 | 0.000 | 0.465 | 0.000 | ||
| 3 spectra, SGNSESK | 0.000 | 0.000 | 0.000 | 0.000 | 0.559 | 0.000 | 0.440 | 0.000 | ||
| 1 spectrum, TEGKPADVK | 0.000 | 0.000 | 0.000 | 0.000 | 0.597 | 0.000 | 0.284 | 0.119 | ||
| 3 spectra, DTMSSVEPDISSAK | 0.000 | 0.000 | 0.000 | 0.425 | 0.000 | 0.000 | 0.380 | 0.196 | ||
| 1 spectrum, TSPSKPSSAPALRPGPK | 0.000 | 0.000 | 0.000 | 0.401 | 0.000 | 0.000 | 0.156 | 0.443 | ||
| 1 spectrum, DVSPSPETETAK | 0.000 | 0.000 | 0.000 | 0.258 | 0.166 | 0.000 | 0.509 | 0.066 | ||
| 1 spectrum, LATTVSAPDLK | 0.000 | 0.000 | 0.000 | 0.000 | 0.551 | 0.000 | 0.263 | 0.186 | ||
| 4 spectra, VATVQIK | 0.000 | 0.000 | 0.000 | 0.255 | 0.251 | 0.000 | 0.378 | 0.115 | ||
| 2 spectra, SSVALSVDK | 0.000 | 0.000 | 0.000 | 0.000 | 0.604 | 0.026 | 0.371 | 0.000 |
| Plot | Mito | Lyso or Perox | ER | Golgi | PM | Cytosol | Nucleus | ||||||
| Expt B |
8 peptides |
11 spectra |
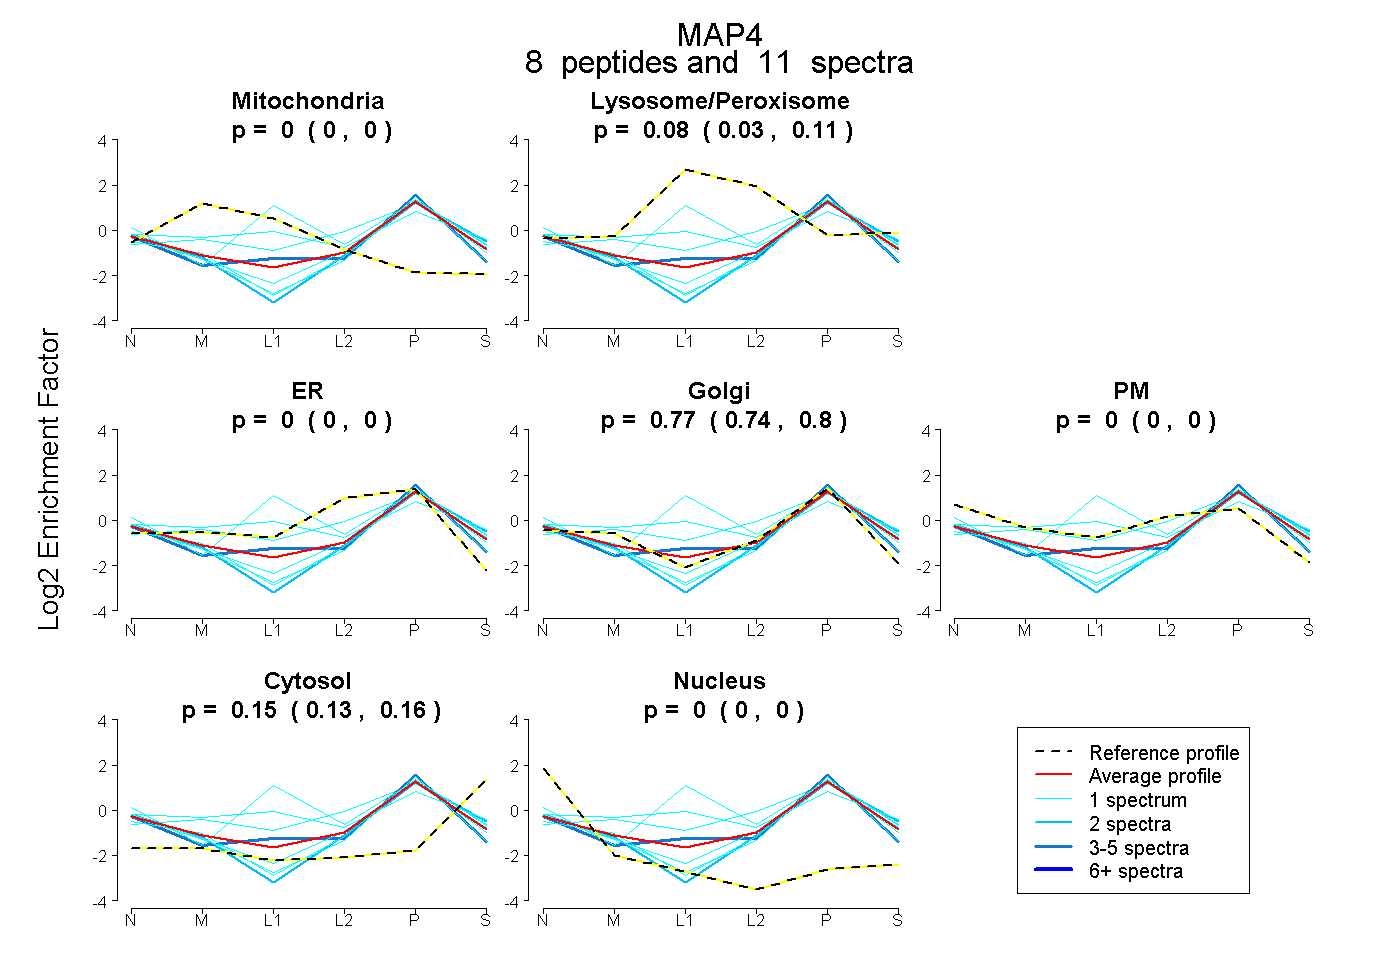 |
0.000 0.000 | 0.000 |
0.078 0.035 | 0.113 |
0.000 0.000 | 0.000 |
0.774 0.745 | 0.800 |
0.000 0.000 | 0.000 |
0.148 0.127 | 0.164 |
0.000 0.000 | 0.000 |
|||
| Plot | Lyso | Other | |||||||||||
| Expt C |
13 peptides |
38 spectra |
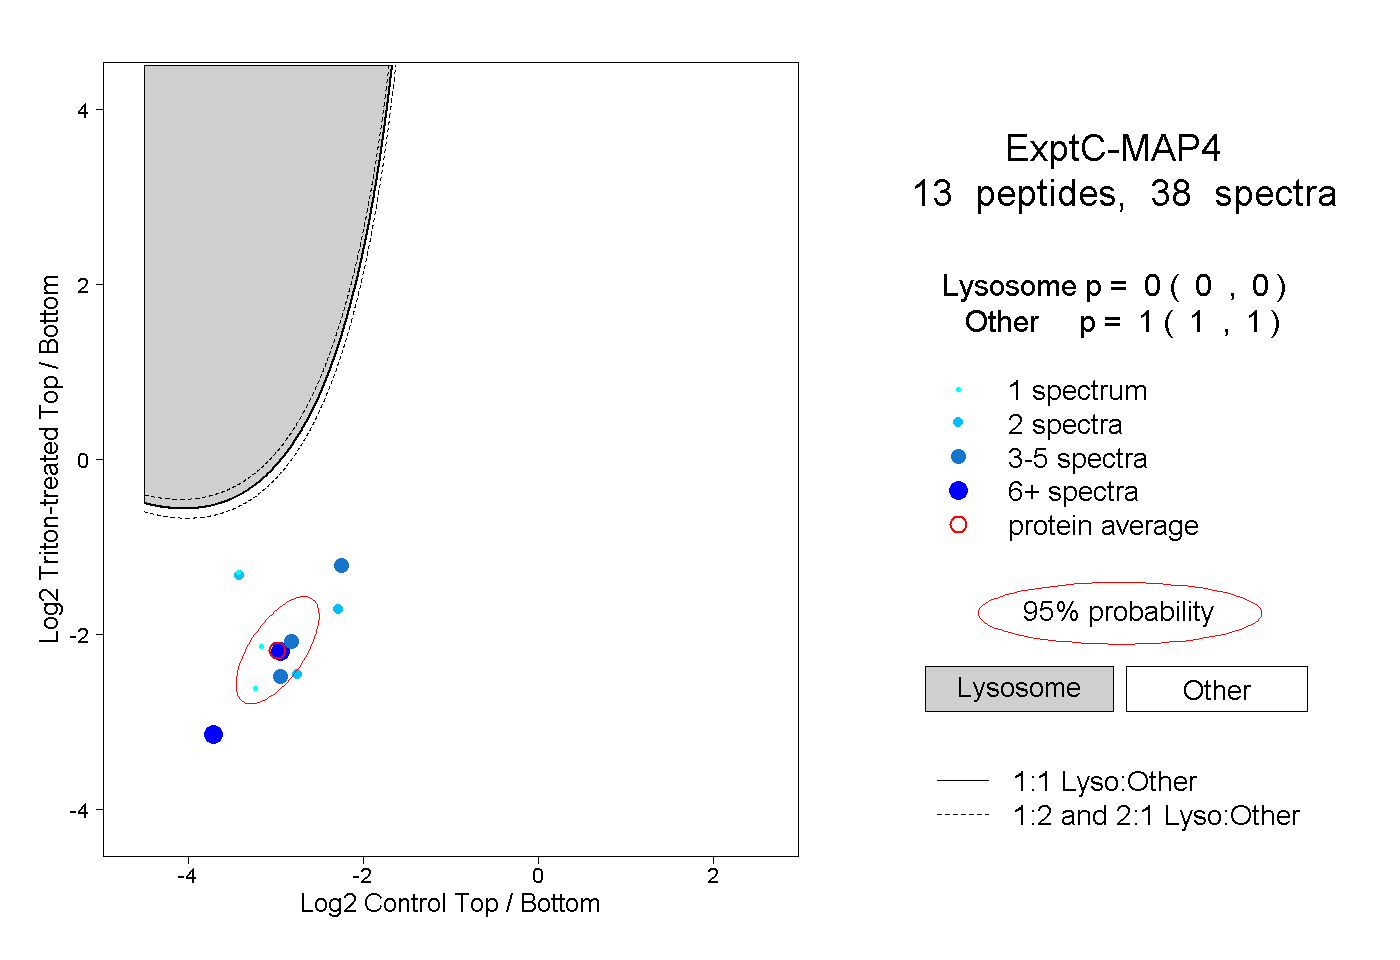 |
0.000 0.000 | 0.000 |
1.000 1.000 | 1.000 |
||||||||
| Plot | Lyso | Other | |||||||||||
| Expt D |
5 peptides |
5 spectra |
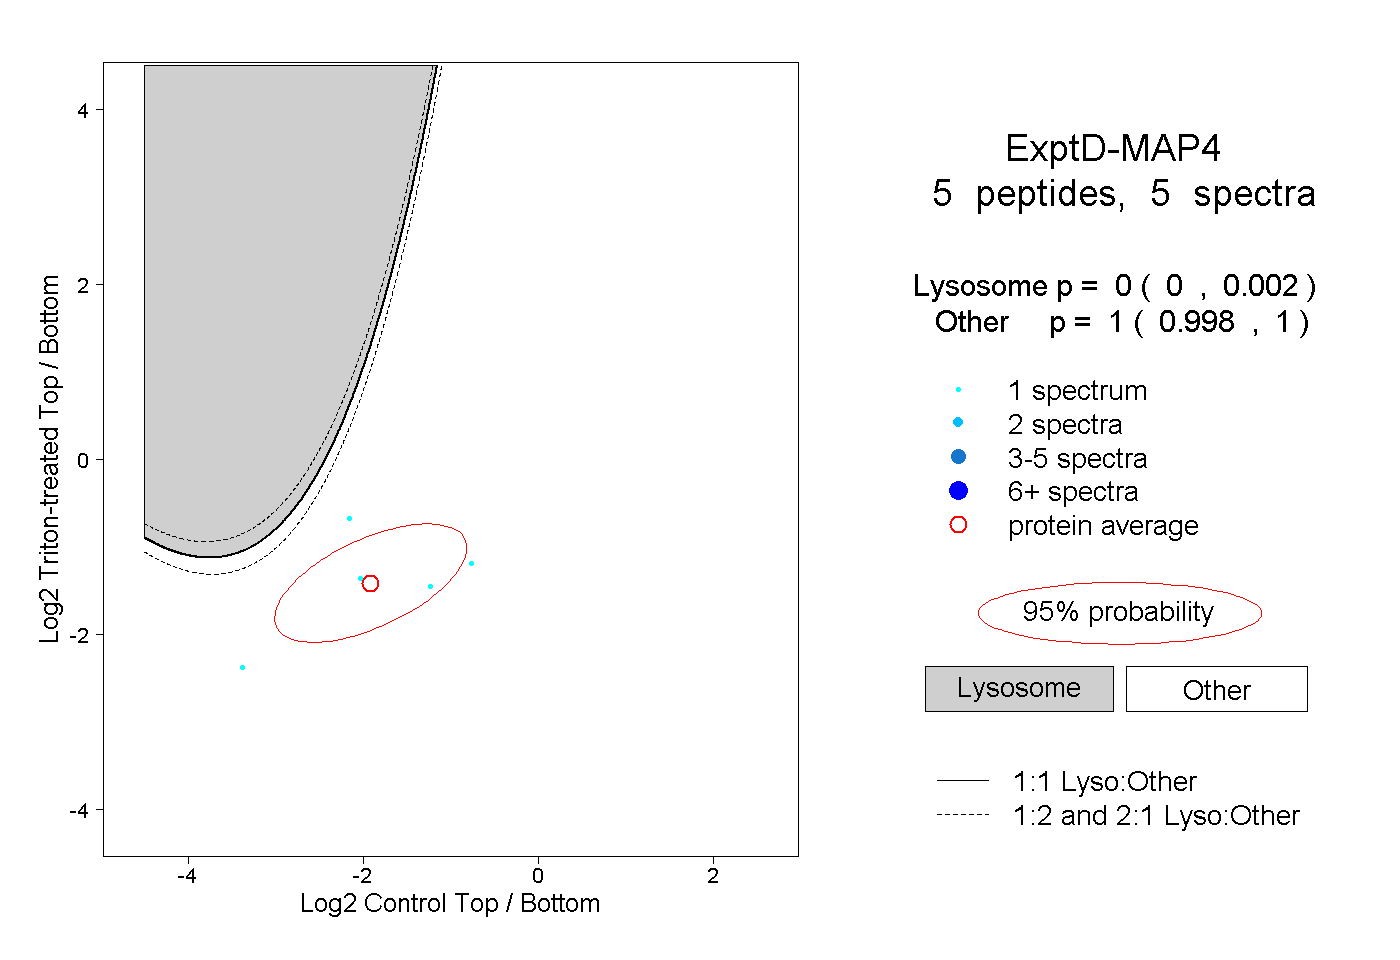 |
0.000 0.000 | 0.002 |
1.000 0.998 | 1.000 |