 4
4peptides
spectra
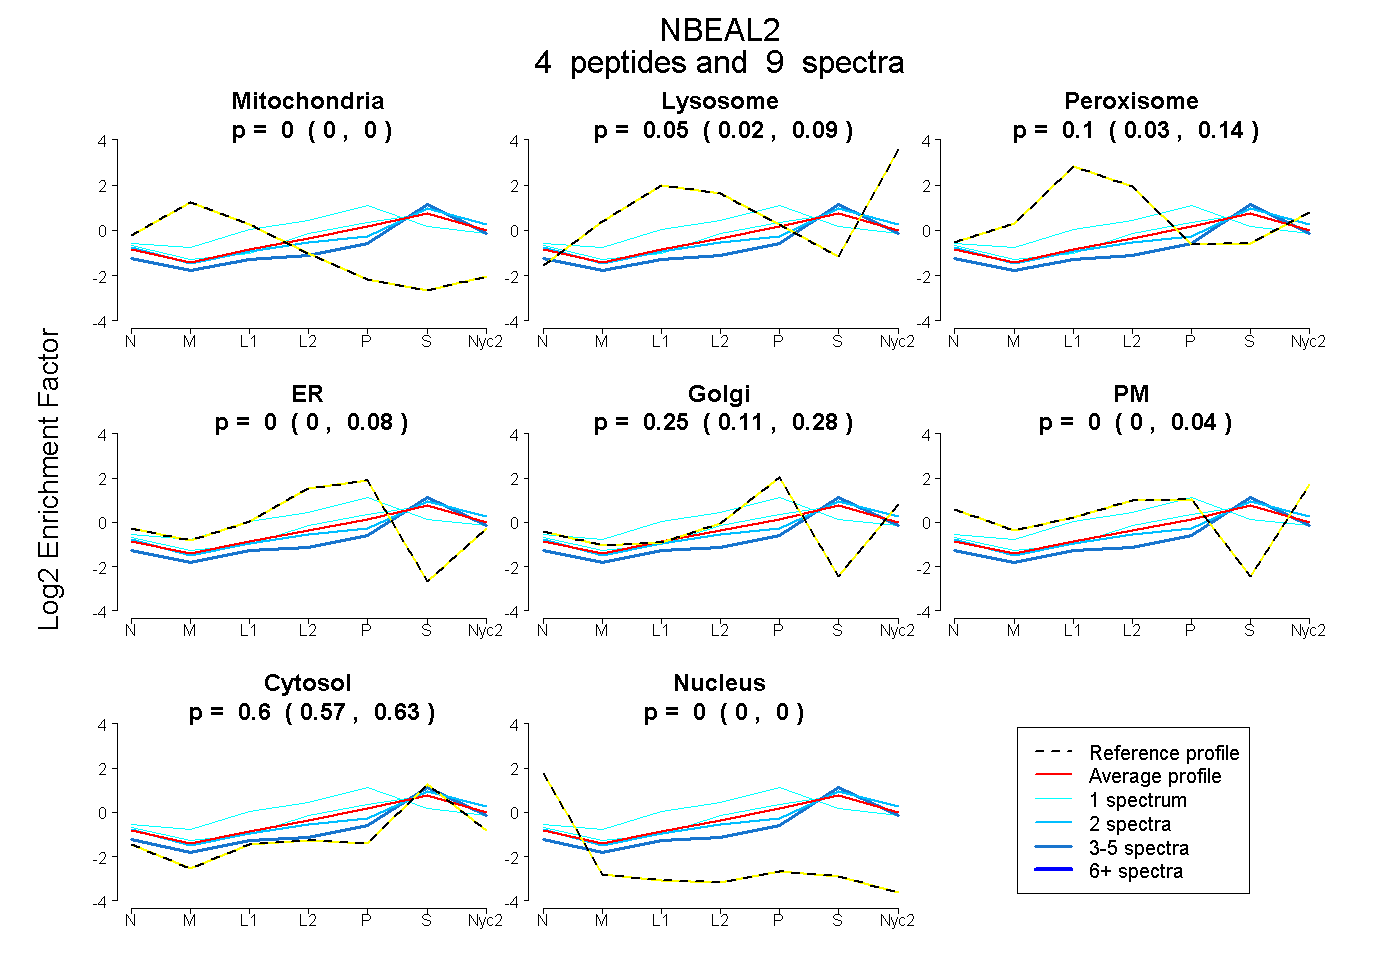
0.000 | 0.000
0.020 | 0.090
0.030 | 0.142
0.000 | 0.082
0.114 | 0.282
0.000 | 0.041
0.566 | 0.634
0.000 | 0.000
1peptide
spectrum
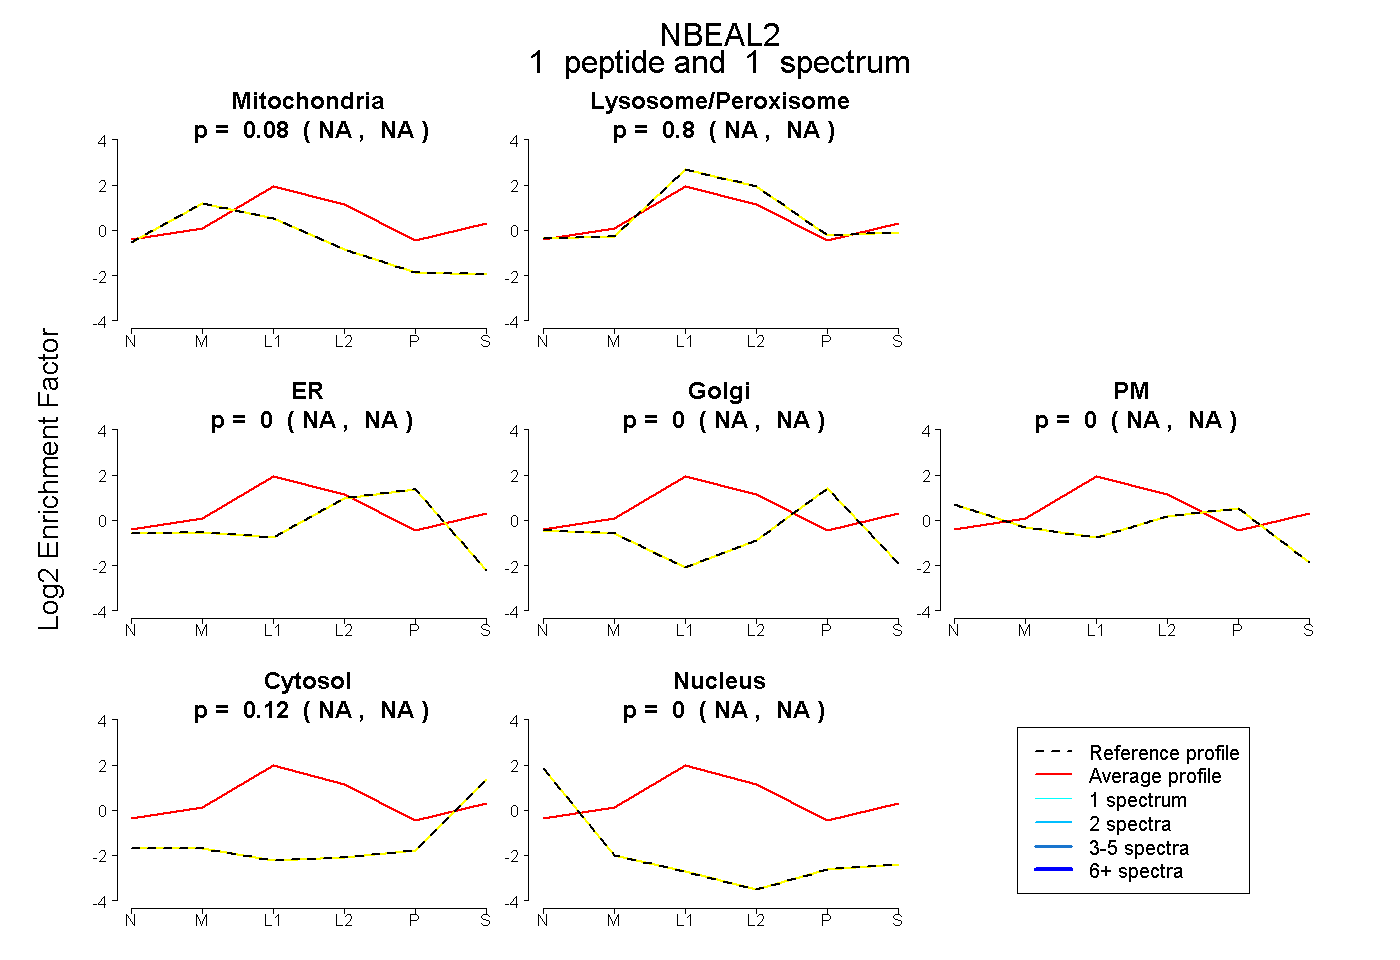
NA | NA
NA | NA
NA | NA
NA | NA
NA | NA
NA | NA
NA | NA
3peptides
spectra
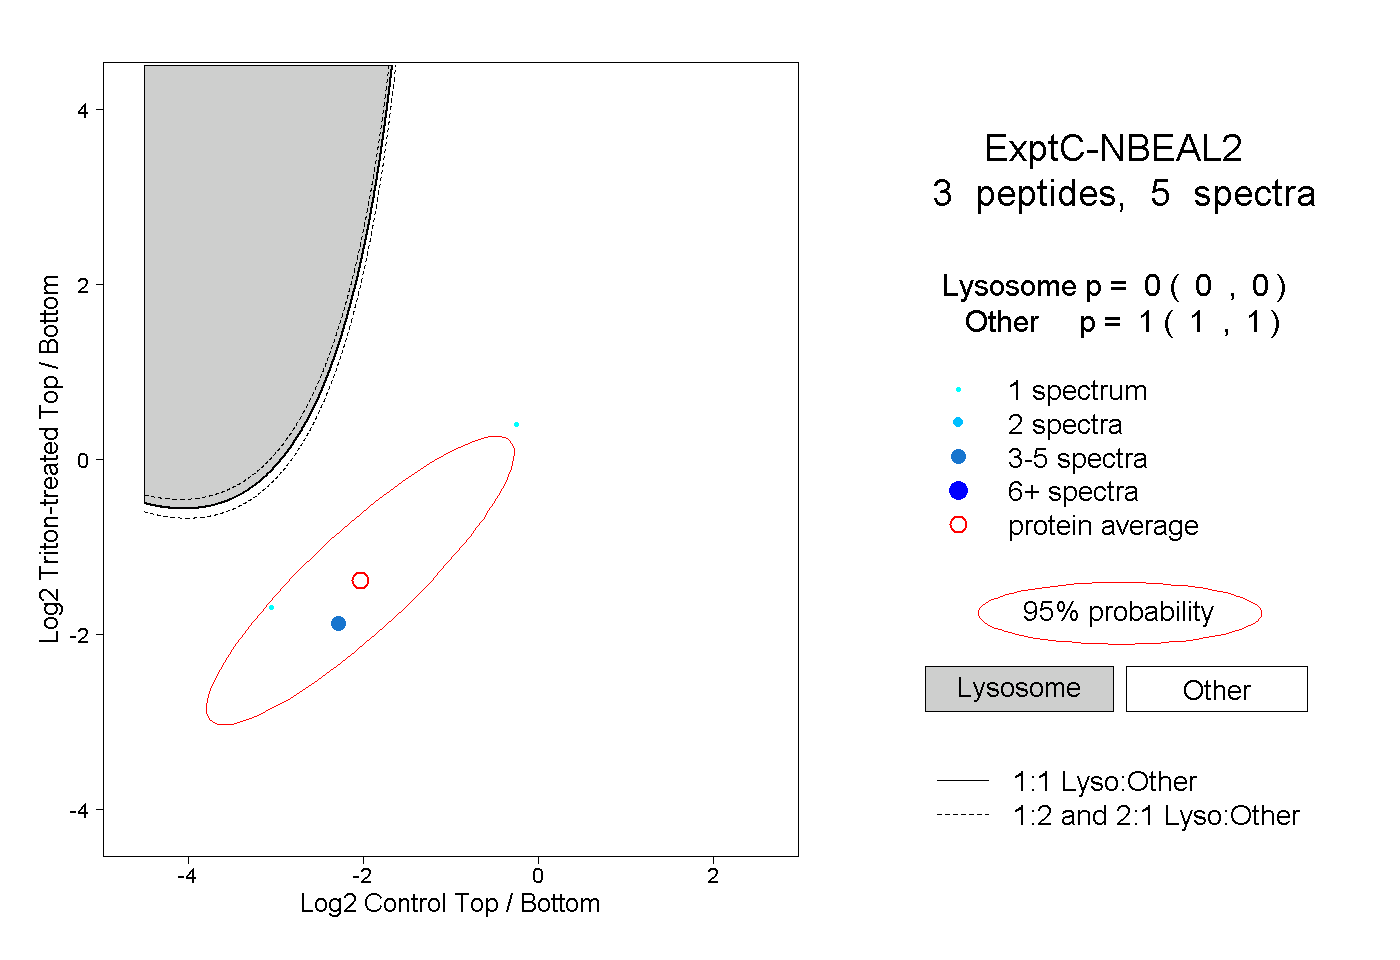
0.000 | 0.000
1.000 | 1.000