 4
4peptides
spectra
0.000 | 0.000
0.020 | 0.090
0.030 | 0.142
0.000 | 0.082
0.114 | 0.282
0.000 | 0.041
0.566 | 0.634
0.000 | 0.000
| Plot | Mito | Lyso | Perox | ER | Golgi | PM | Cytosol | Nucleus | |||||
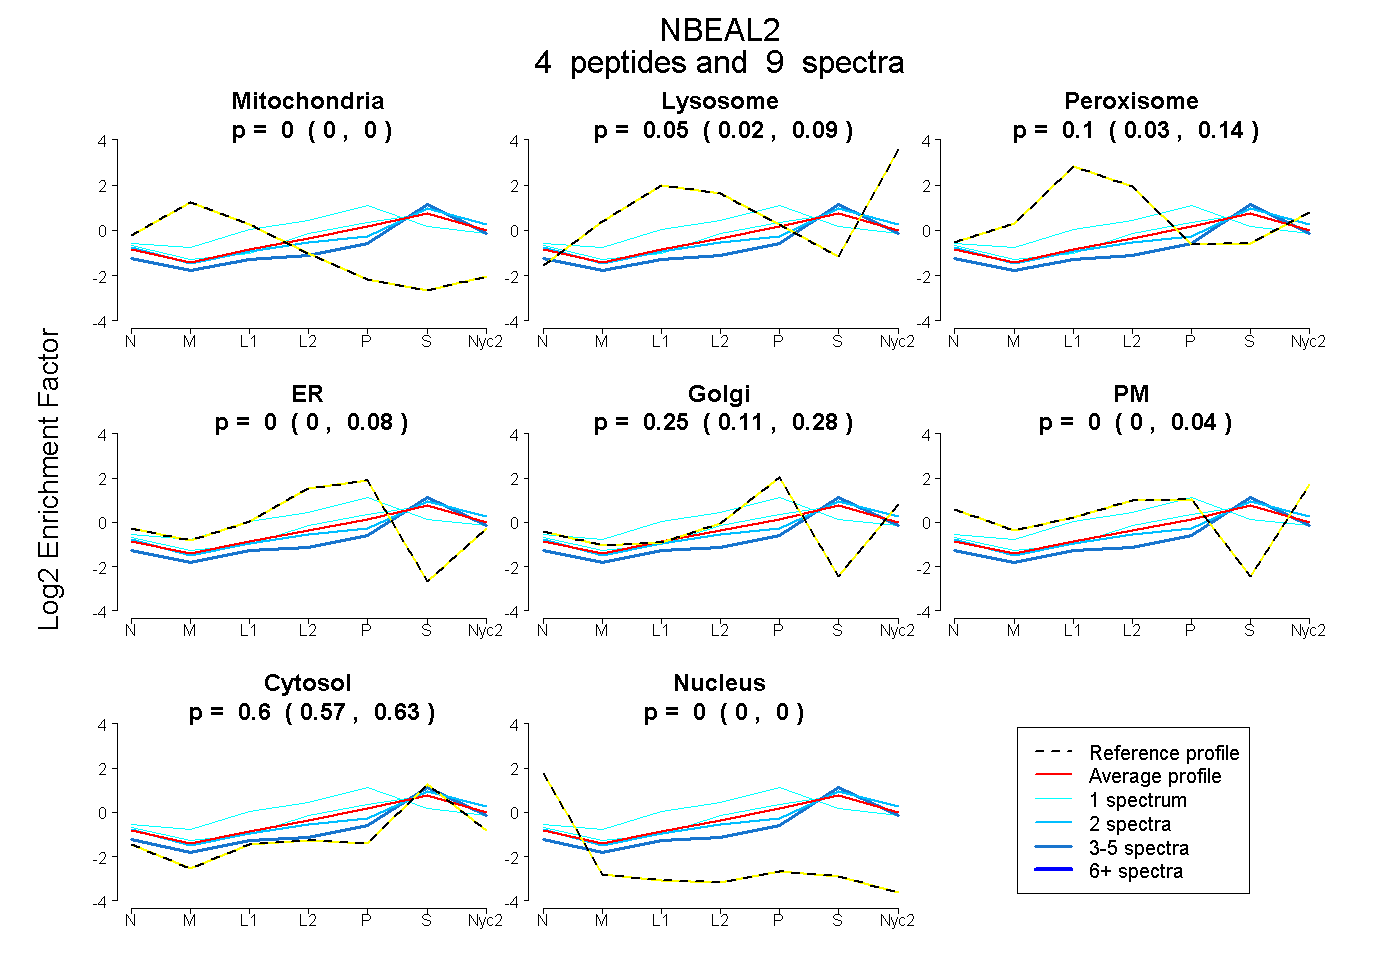
| Expt A |
4 peptides |
9 spectra |
|
0.000 0.000 | 0.000 |
0.050 0.020 | 0.090 |
0.105 0.030 | 0.142 |
0.000 0.000 | 0.082 |
0.247 0.114 | 0.282 |
0.000 0.000 | 0.041 |
0.599 0.566 | 0.634 |
0.000 0.000 | 0.000 |
| 2 spectra, VETEEGIGHDFR | 0.000 | 0.115 | 0.000 | 0.000 | 0.027 | 0.161 | 0.697 | 0.000 | ||
| 5 spectra, RPLAQLR | 0.000 | 0.082 | 0.000 | 0.000 | 0.101 | 0.000 | 0.817 | 0.000 | ||
| 1 spectrum, AQHAGAIIR | 0.000 | 0.044 | 0.089 | 0.044 | 0.245 | 0.010 | 0.568 | 0.000 | ||
| 1 spectrum, LGHIQYMSSIIR | 0.000 | 0.000 | 0.243 | 0.237 | 0.190 | 0.000 | 0.330 | 0.000 |
| Plot | Mito | Lyso or Perox | ER | Golgi | PM | Cytosol | Nucleus | ||||||
| Expt B |
1 peptide |
1 spectrum |
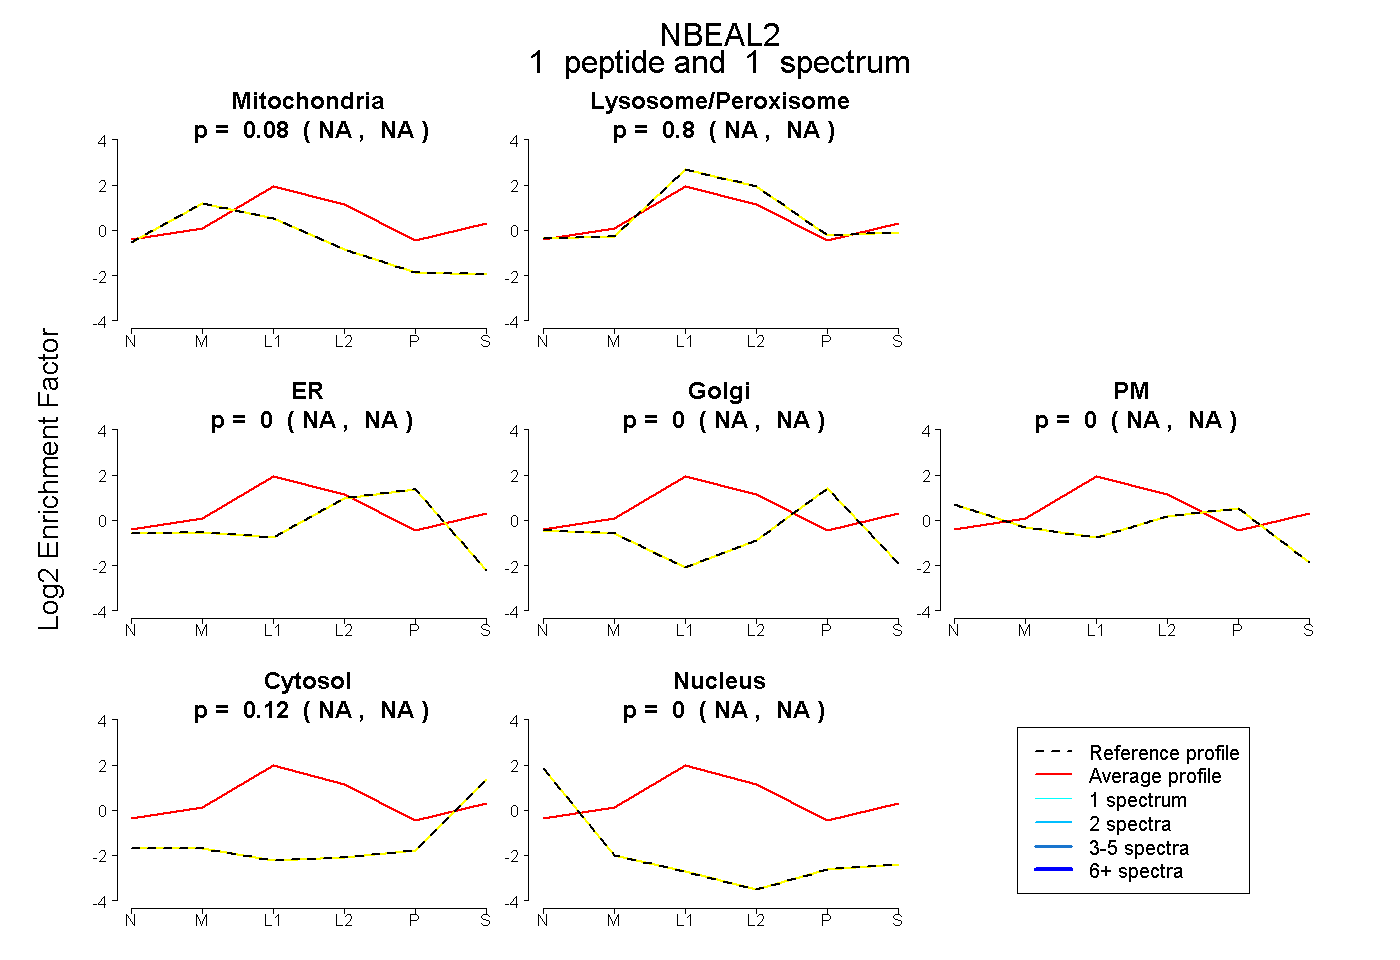 |
0.083 NA | NA |
0.798 NA | NA |
0.000 NA | NA |
0.000 NA | NA |
0.000 NA | NA |
0.119 NA | NA |
0.000 NA | NA |
|||
| Plot | Lyso | Other | |||||||||||
| Expt C |
3 peptides |
5 spectra |
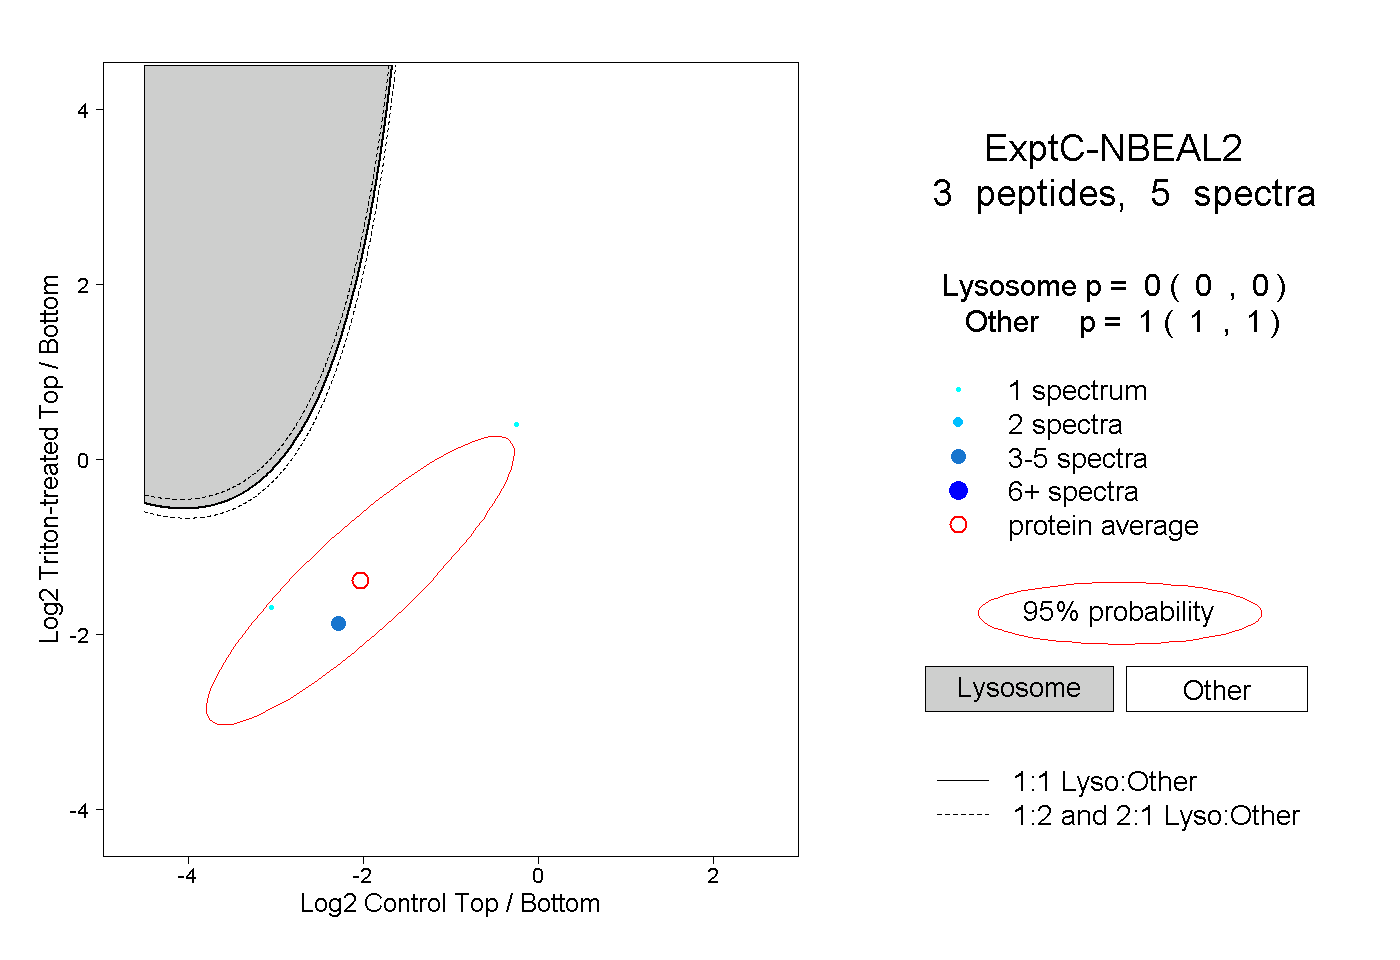 |
0.000 0.000 | 0.000 |
1.000 1.000 | 1.000 |