 4
4peptides
spectra
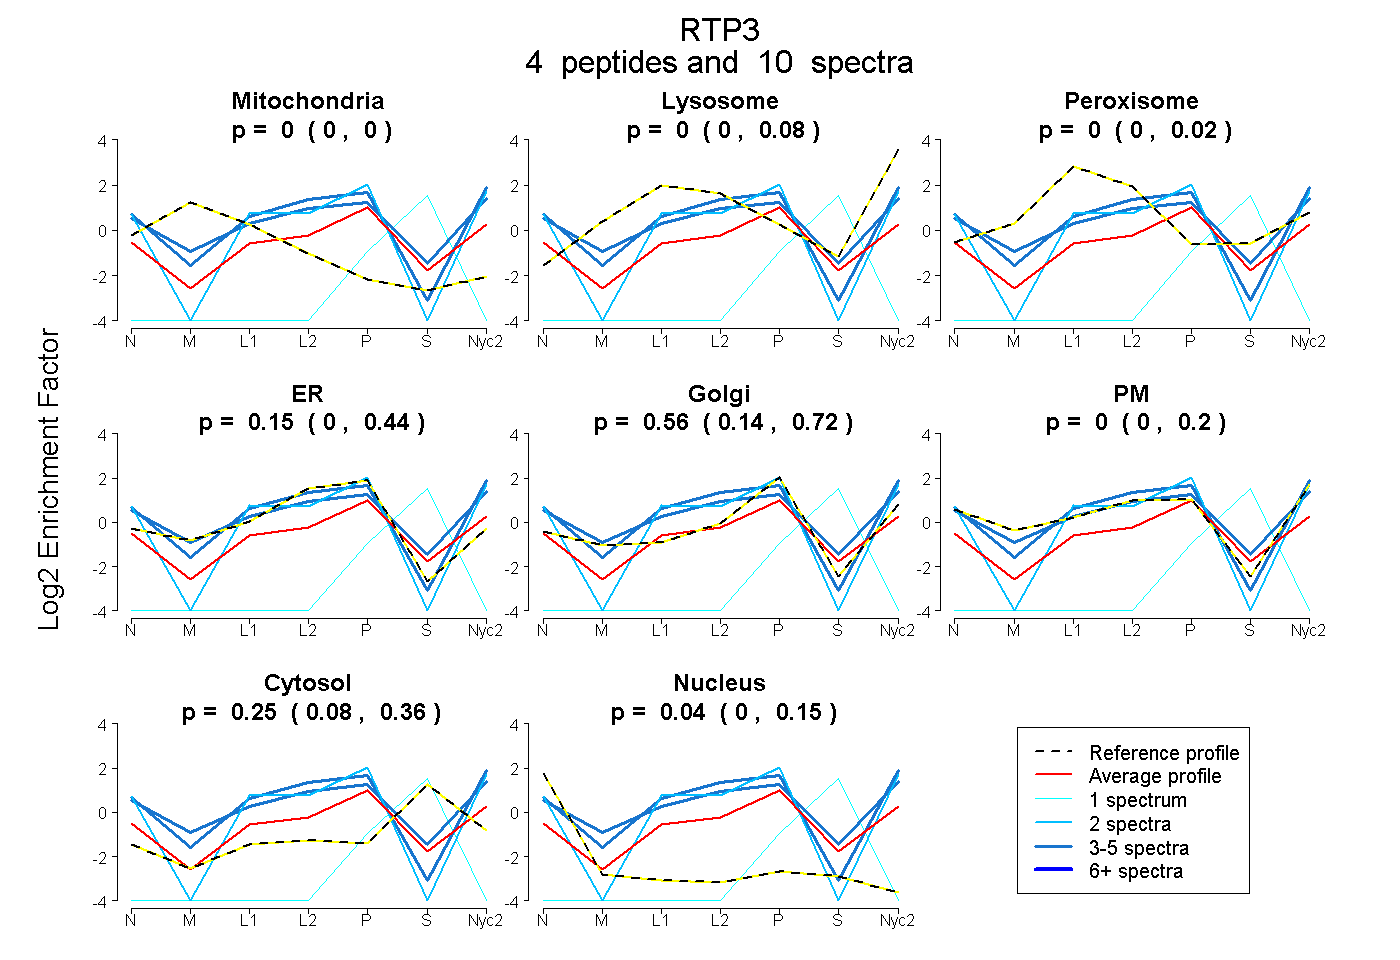
0.000 | 0.000
0.000 | 0.082
0.000 | 0.016
0.000 | 0.442
0.141 | 0.716
0.000 | 0.201
0.079 | 0.360
0.000 | 0.145
2peptides
spectra
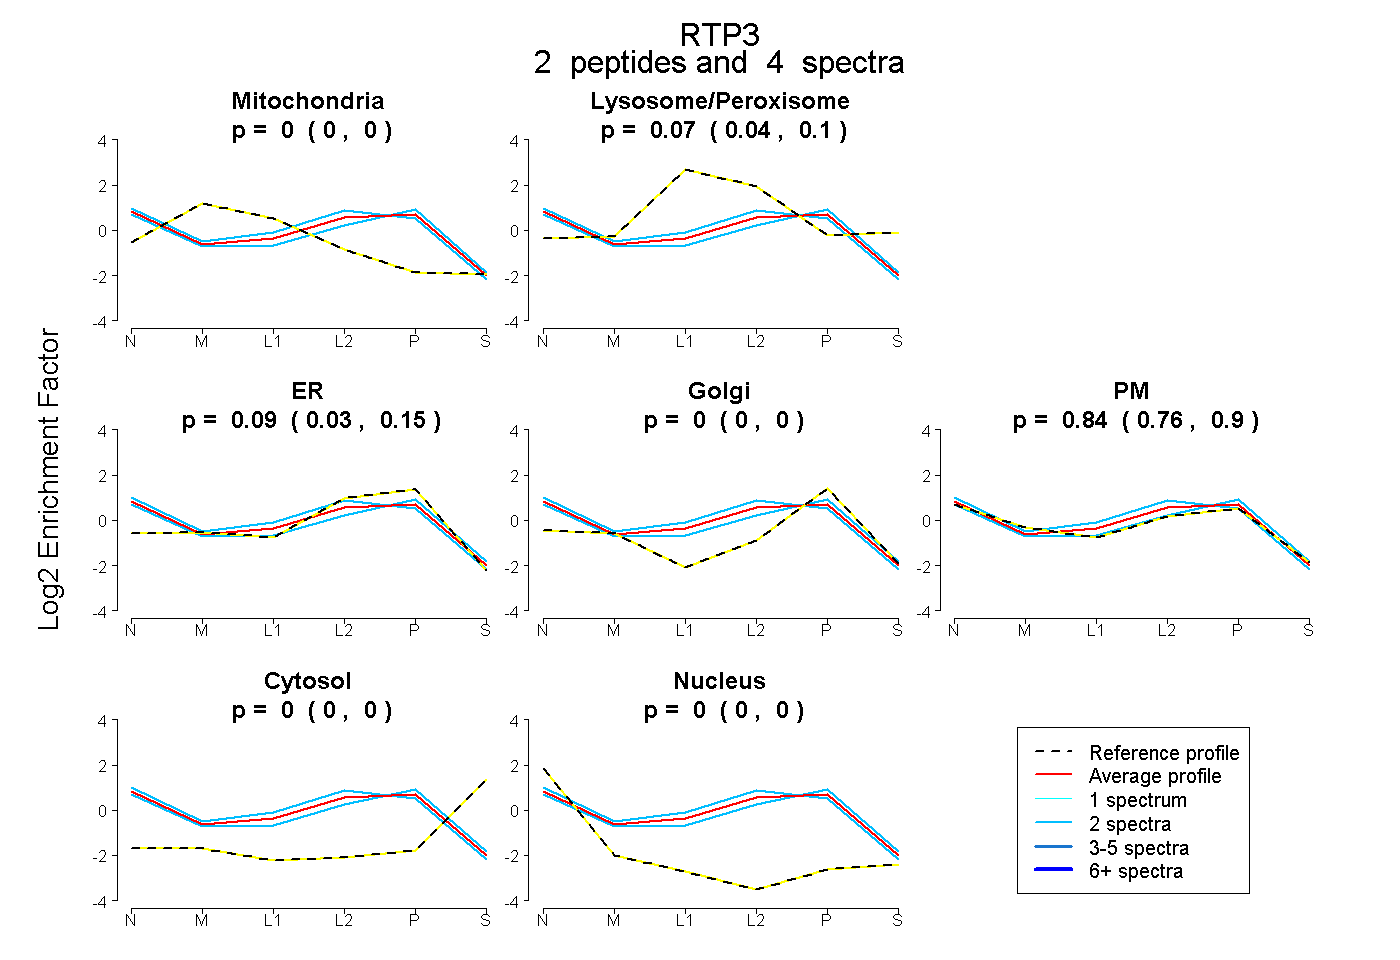
0.000 | 0.000
0.036 | 0.103
0.032 | 0.152
0.000 | 0.000
0.759 | 0.895
0.000 | 0.000
0.000 | 0.000
6peptides
spectra
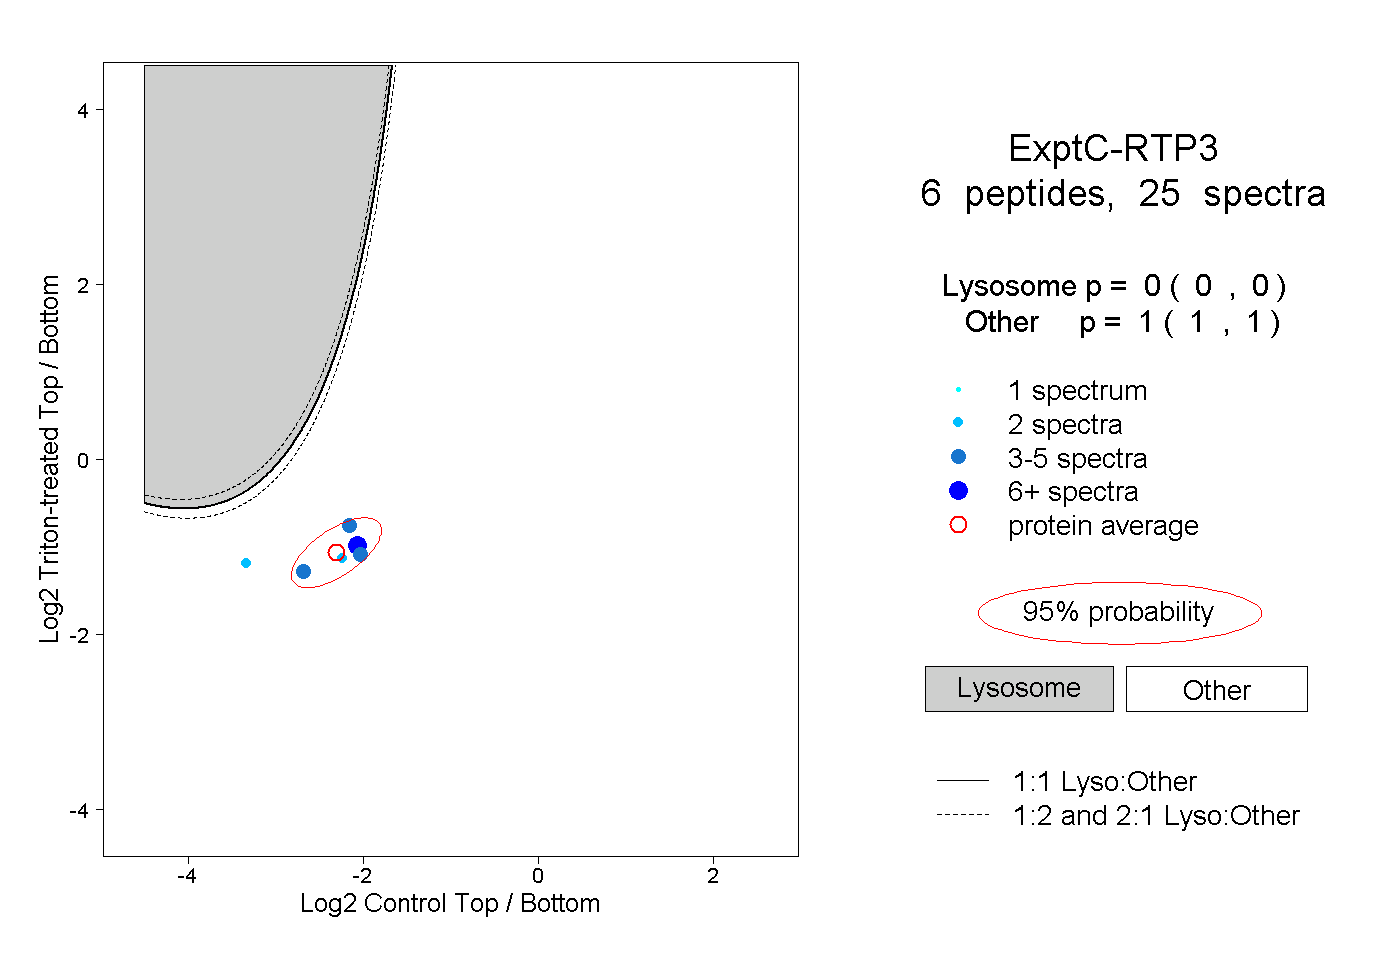
0.000 | 0.000
1.000 | 1.000
1peptide
spectrum
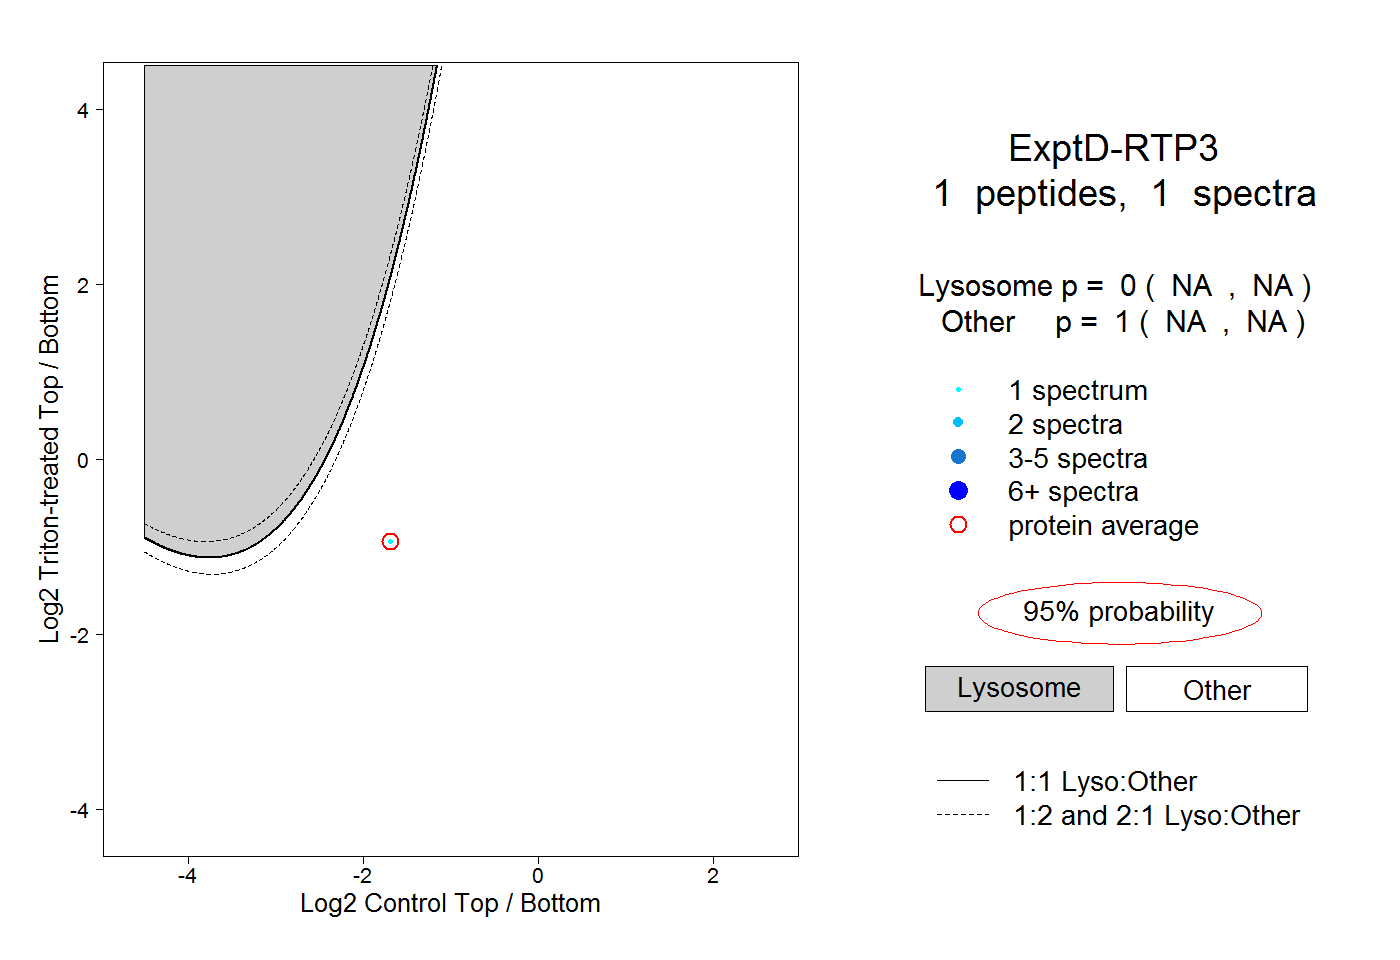
NA | NA
NA | NA