 4
4peptides
spectra
0.000 | 0.000
0.000 | 0.082
0.000 | 0.016
0.000 | 0.442
0.141 | 0.716
0.000 | 0.201
0.079 | 0.360
0.000 | 0.145
| Plot | Mito | Lyso | Perox | ER | Golgi | PM | Cytosol | Nucleus | |||||
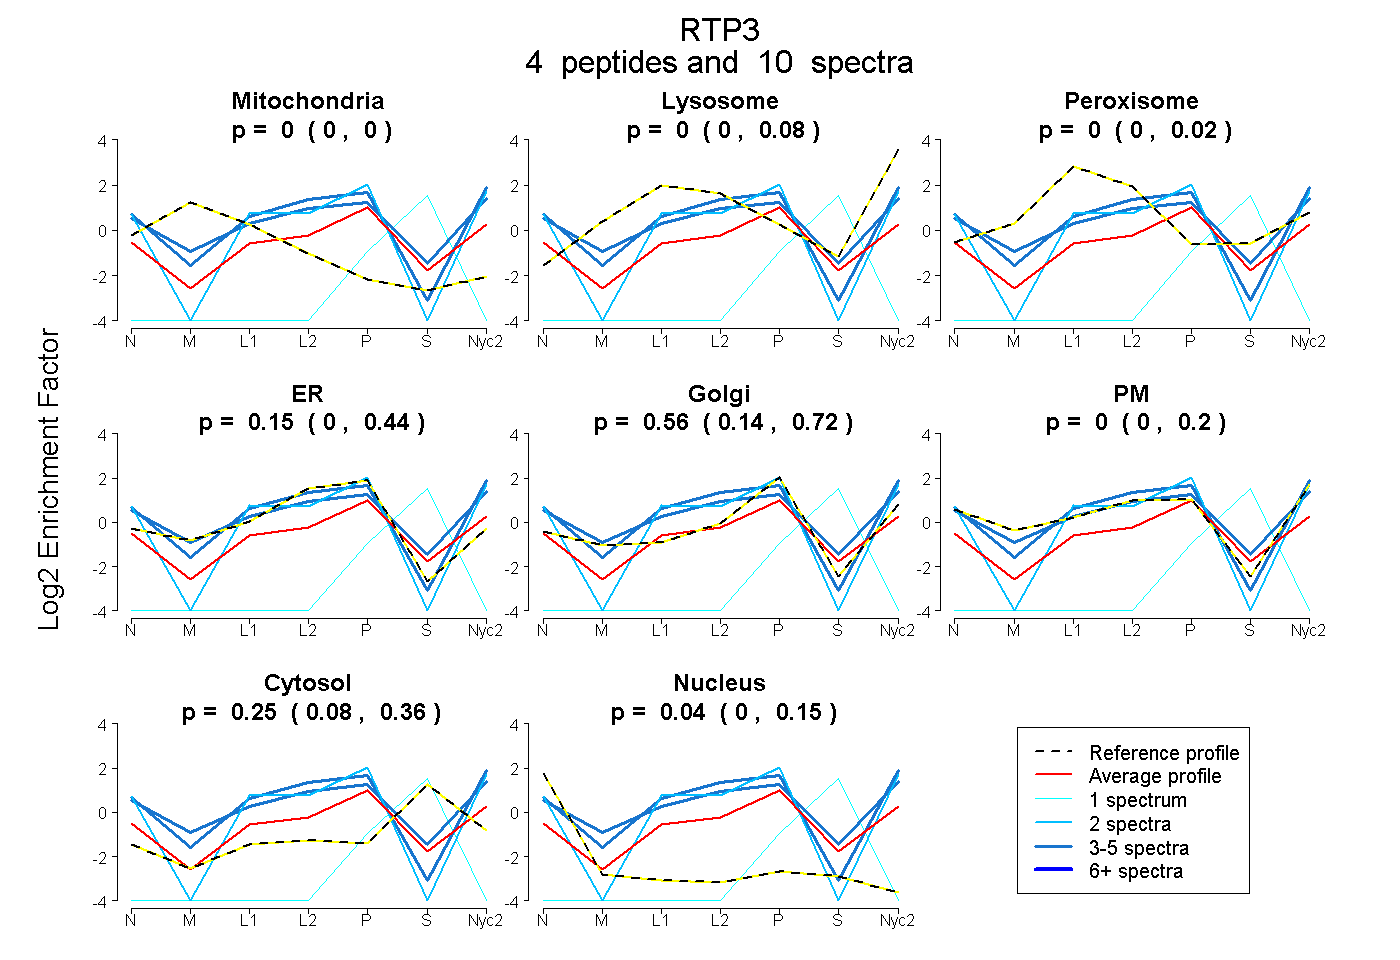
| Expt A |
4 peptides |
10 spectra |
|
0.000 0.000 | 0.000 |
0.000 0.000 | 0.082 |
0.000 0.000 | 0.016 |
0.146 0.000 | 0.442 |
0.559 0.141 | 0.716 |
0.000 0.000 | 0.201 |
0.255 0.079 | 0.360 |
0.041 0.000 | 0.145 |
| 4 spectra, RPPANTACQVER | 0.000 | 0.004 | 0.052 | 0.058 | 0.011 | 0.768 | 0.107 | 0.000 | ||
| 2 spectra, VTAACPDLPCSQSSSK | 0.000 | 0.000 | 0.000 | 0.157 | 0.418 | 0.423 | 0.000 | 0.002 | ||
| 3 spectra, TSKPSTNPR | 0.000 | 0.000 | 0.000 | 0.139 | 0.000 | 0.861 | 0.000 | 0.000 | ||
| 1 spectrum, QLSEVSSSALECVIQMPSPISSNR | 0.000 | 0.000 | 0.000 | 0.000 | 0.000 | 0.000 | 0.798 | 0.202 |
| Plot | Mito | Lyso or Perox | ER | Golgi | PM | Cytosol | Nucleus | ||||||
| Expt B |
2 peptides |
4 spectra |
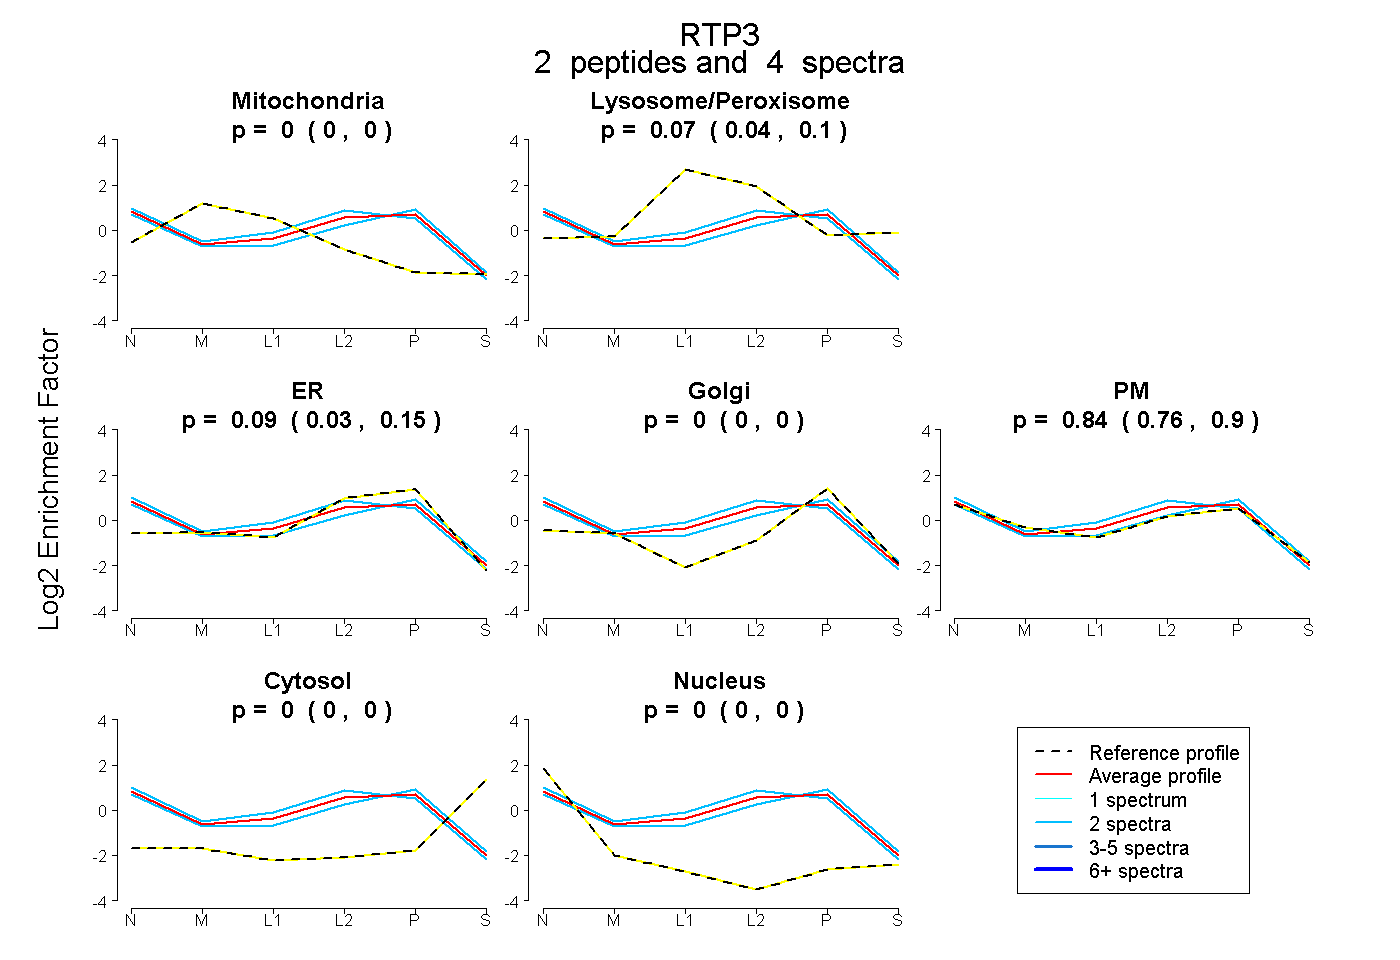 |
0.000 0.000 | 0.000 |
0.072 0.036 | 0.103 |
0.092 0.032 | 0.152 |
0.000 0.000 | 0.000 |
0.836 0.759 | 0.895 |
0.000 0.000 | 0.000 |
0.000 0.000 | 0.000 |
|||
| Plot | Lyso | Other | |||||||||||
| Expt C |
6 peptides |
25 spectra |
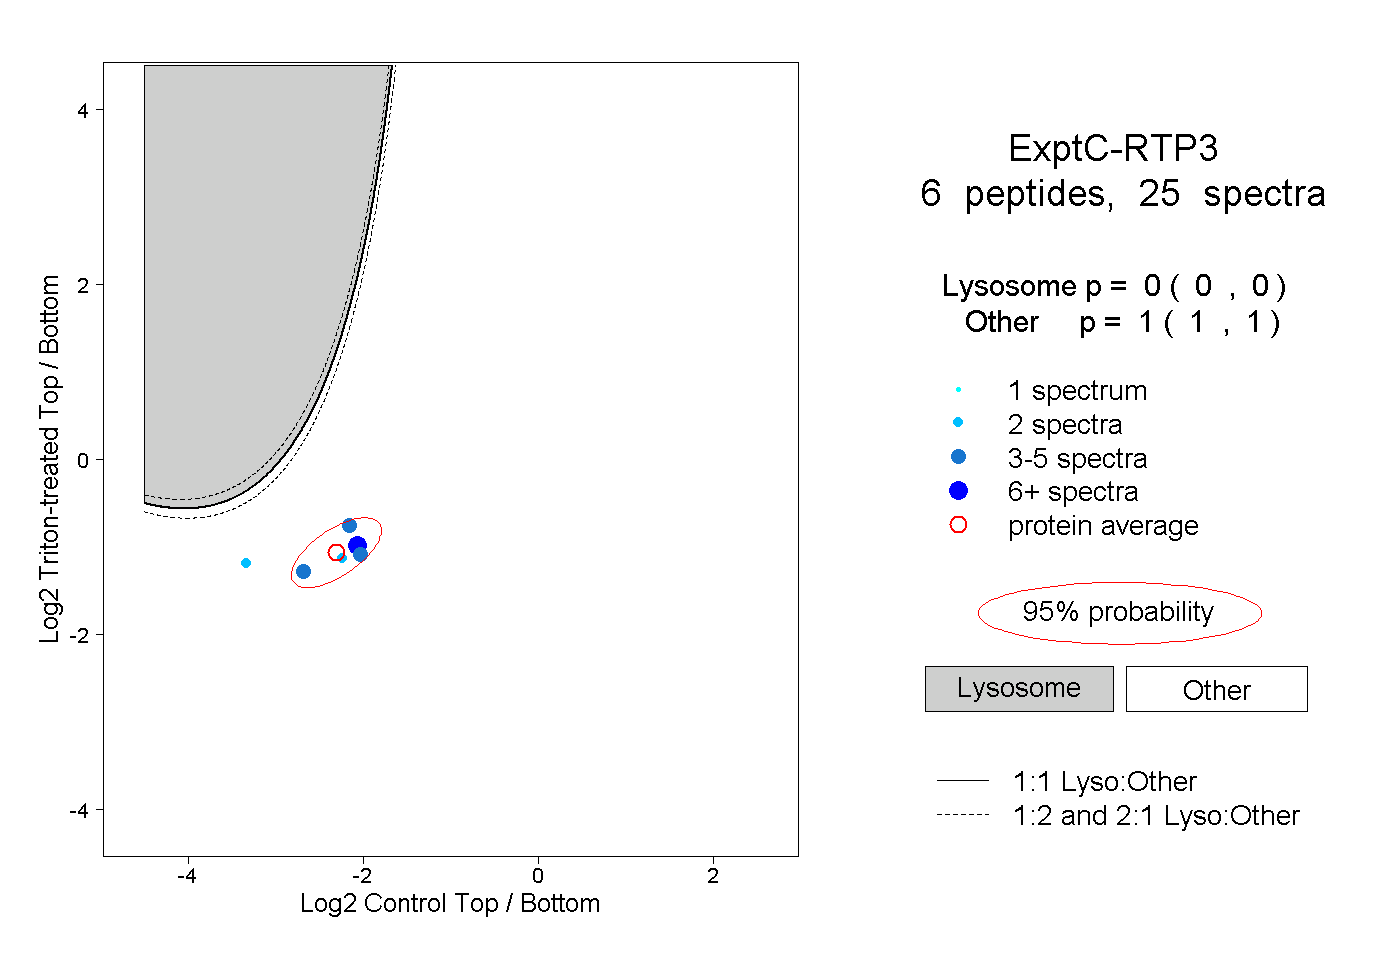 |
0.000 0.000 | 0.000 |
1.000 1.000 | 1.000 |
||||||||
| Plot | Lyso | Other | |||||||||||
| Expt D |
1 peptide |
1 spectrum |
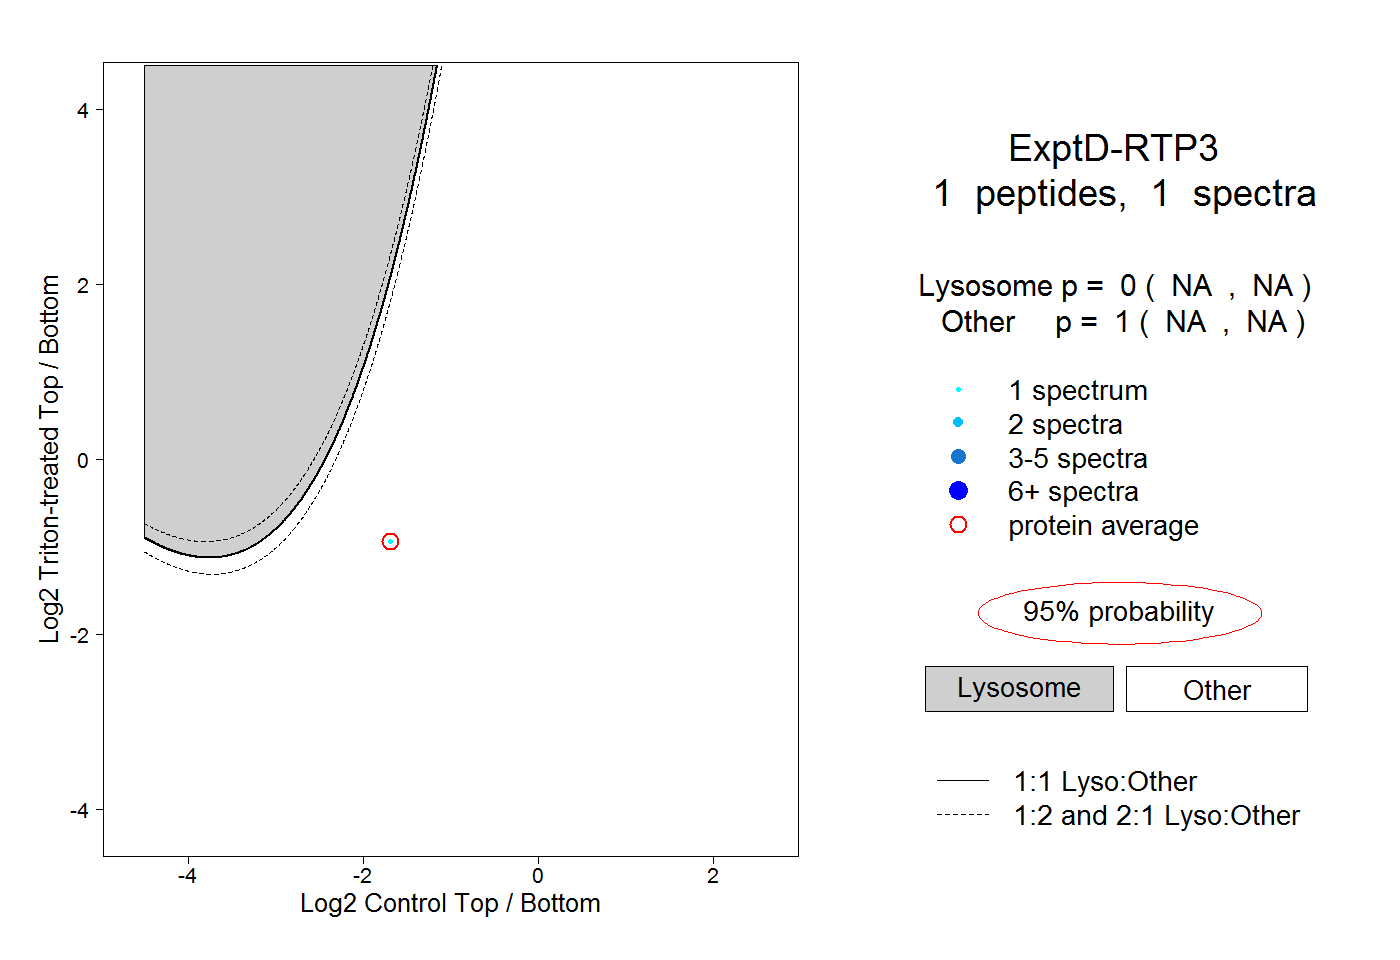 |
0.000 NA | NA |
1.000 NA | NA |