 10
10peptides
spectra
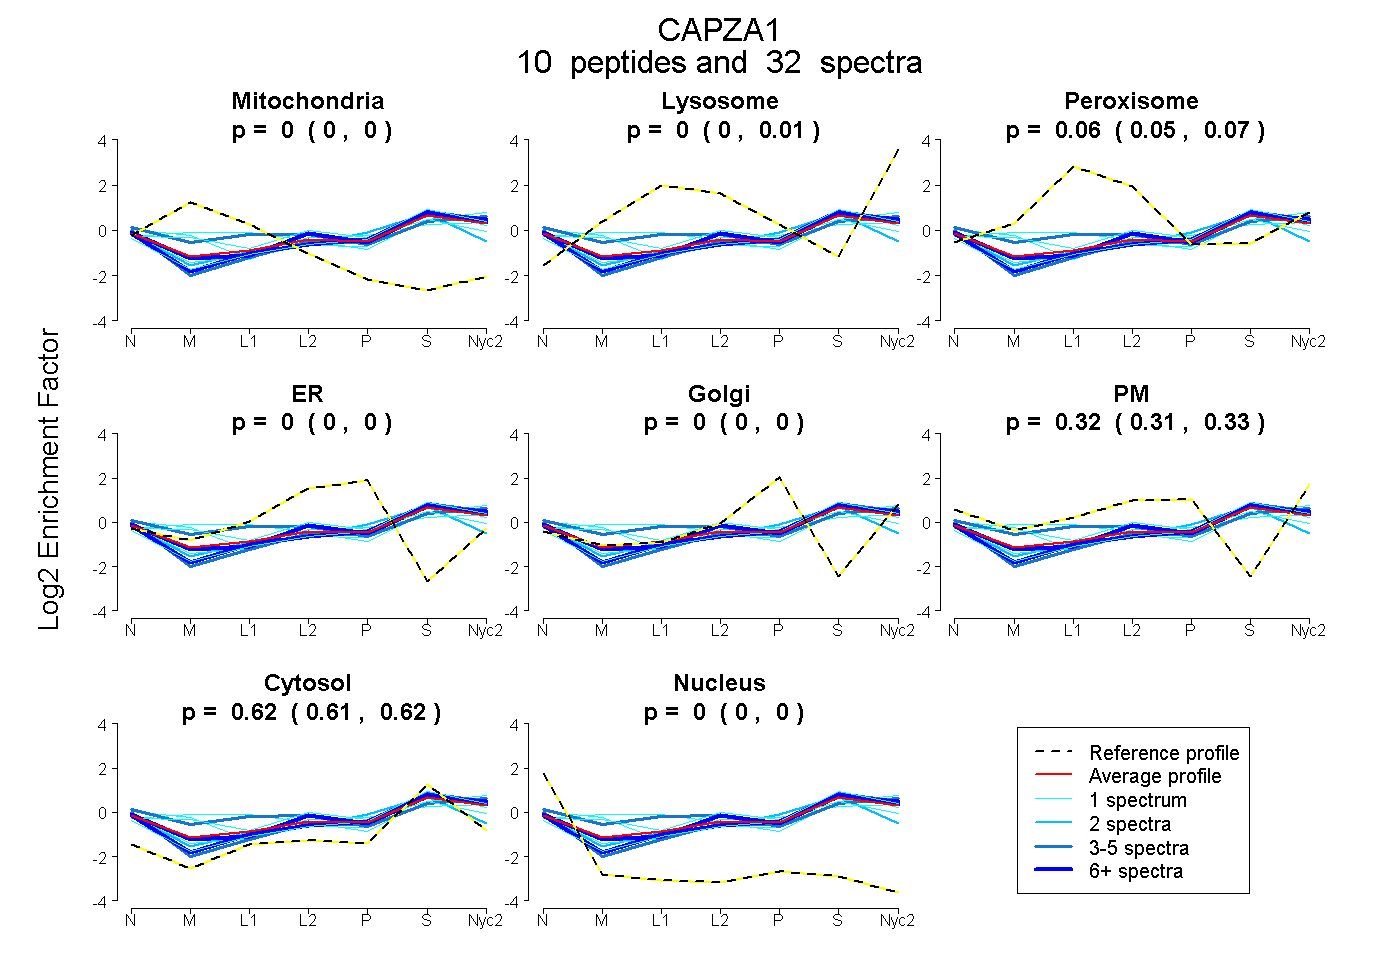
0.000 | 0.000
0.000 | 0.007
0.050 | 0.070
0.000 | 0.000
0.000 | 0.000
0.314 | 0.328
0.609 | 0.622
0.000 | 0.000
1peptide
spectra
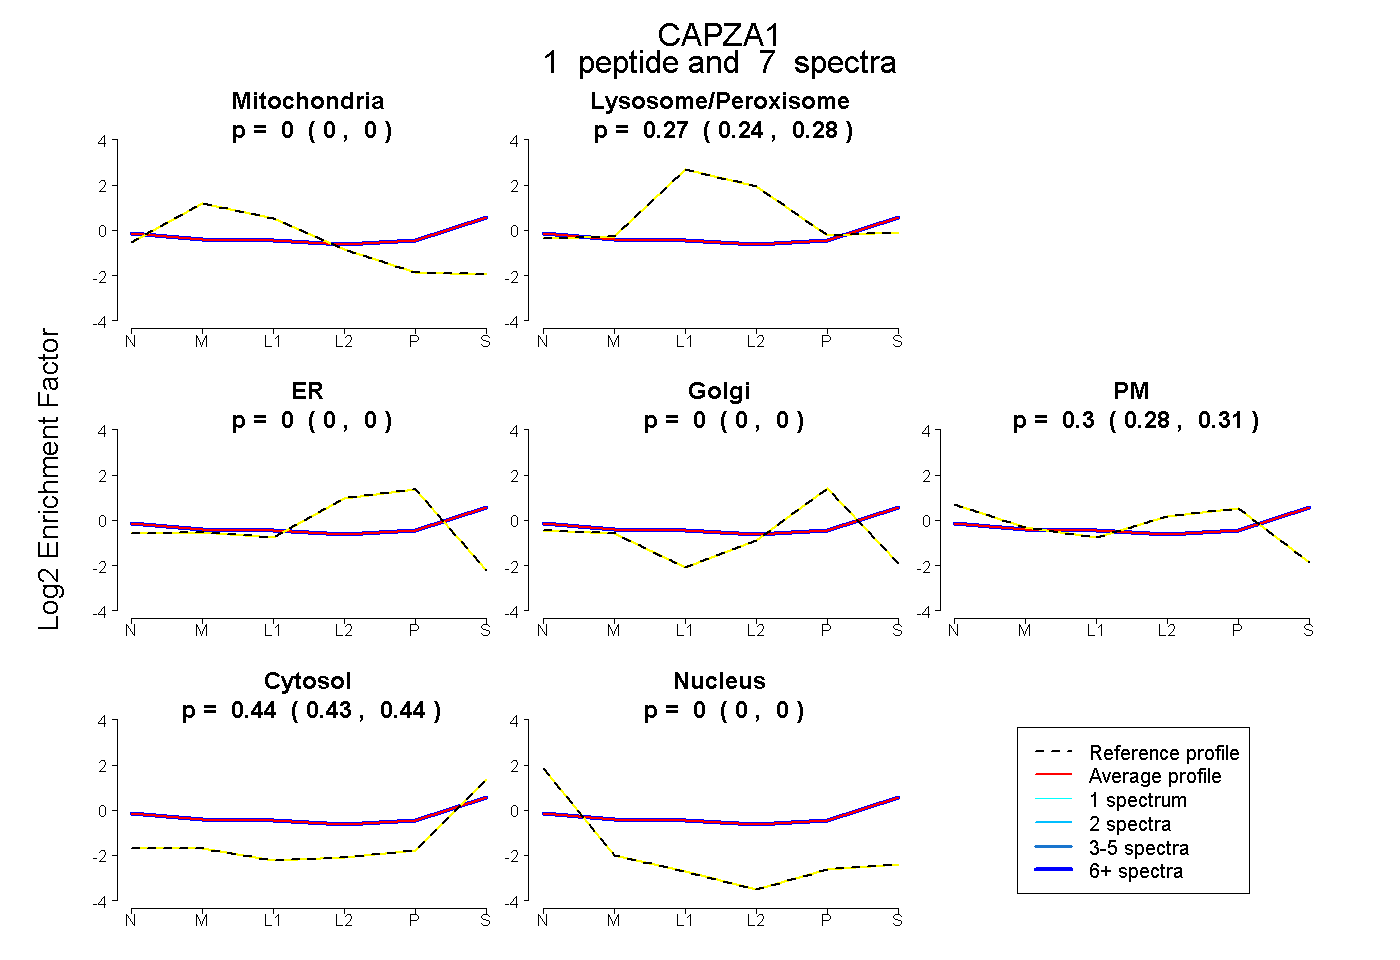
0.000 | 0.003
0.244 | 0.284
0.000 | 0.000
0.000 | 0.000
0.278 | 0.311
0.428 | 0.445
0.000 | 0.000
7peptides
spectra
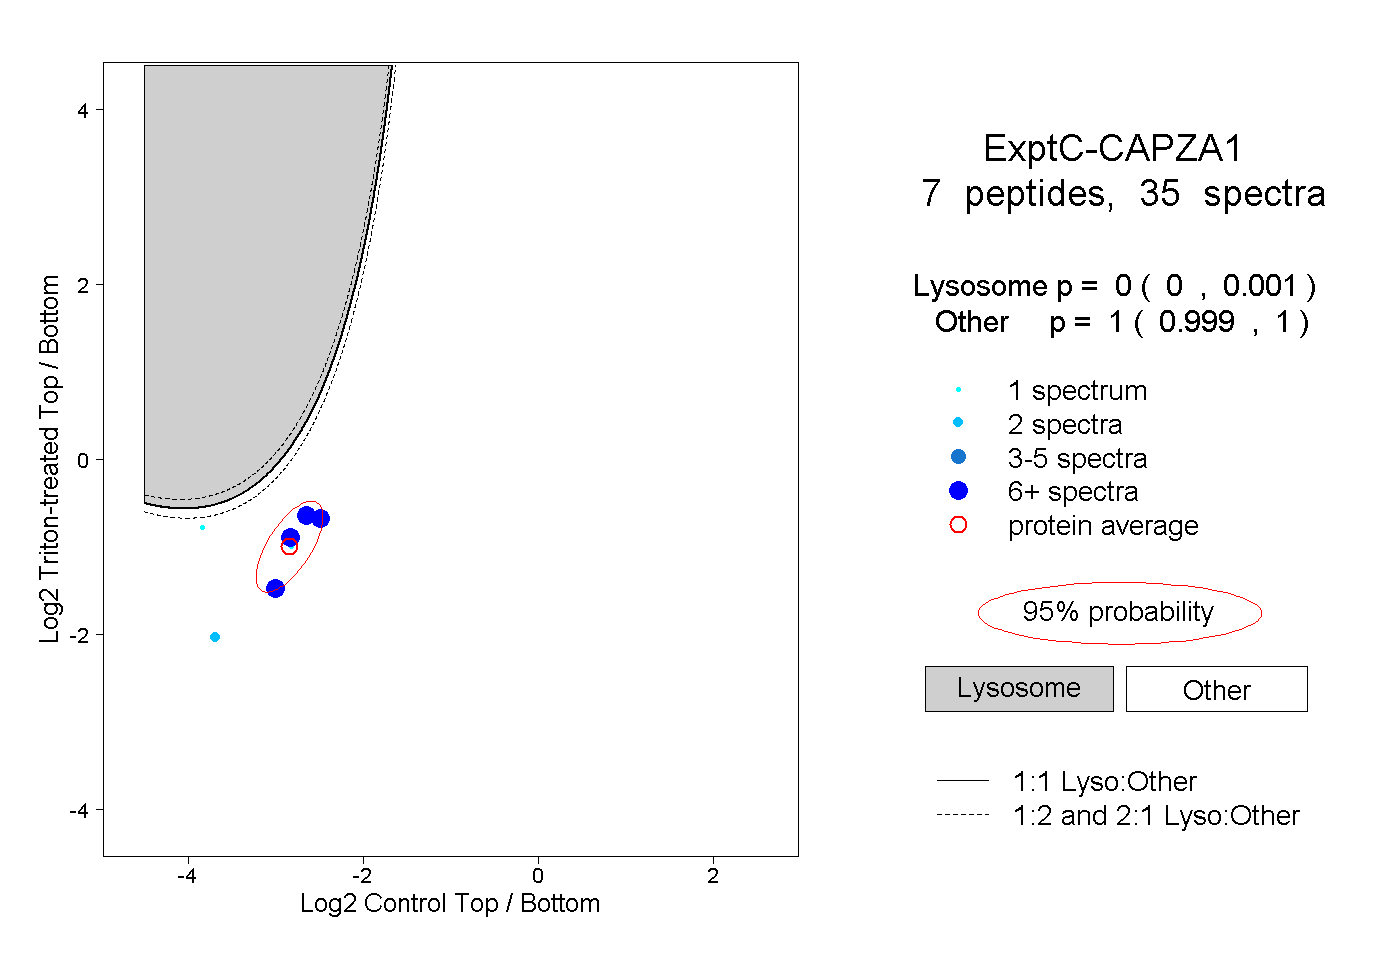
0.000 | 0.001
0.999 | 1.000
2peptides
spectra
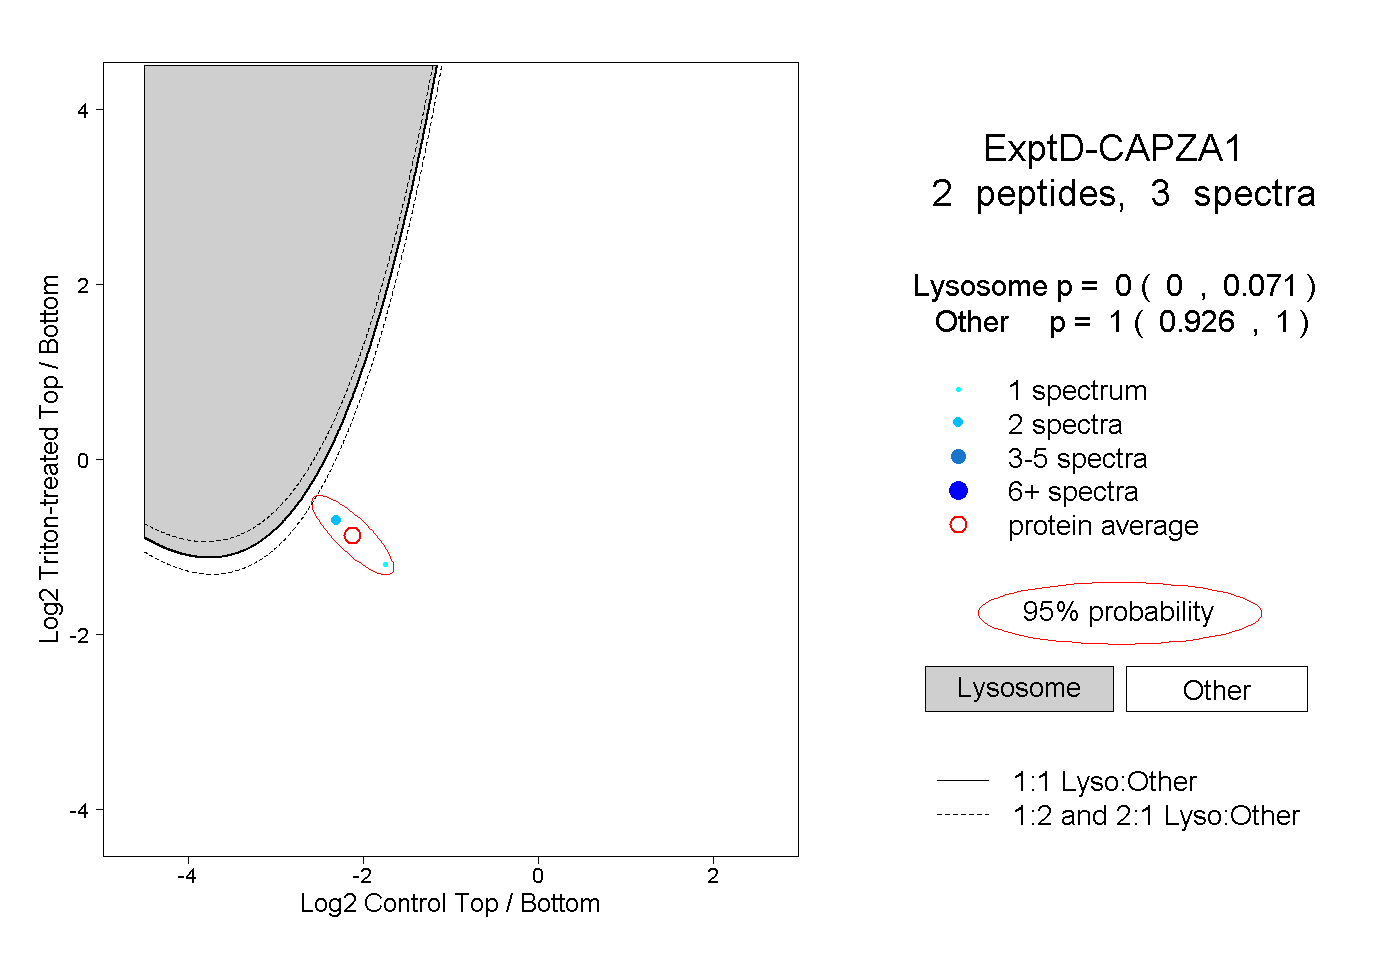
0.000 | 0.071
0.926 | 1.000