 10
10peptides
spectra
0.000 | 0.000
0.000 | 0.007
0.050 | 0.070
0.000 | 0.000
0.000 | 0.000
0.314 | 0.328
0.609 | 0.622
0.000 | 0.000
| Plot | Mito | Lyso | Perox | ER | Golgi | PM | Cytosol | Nucleus | |||||
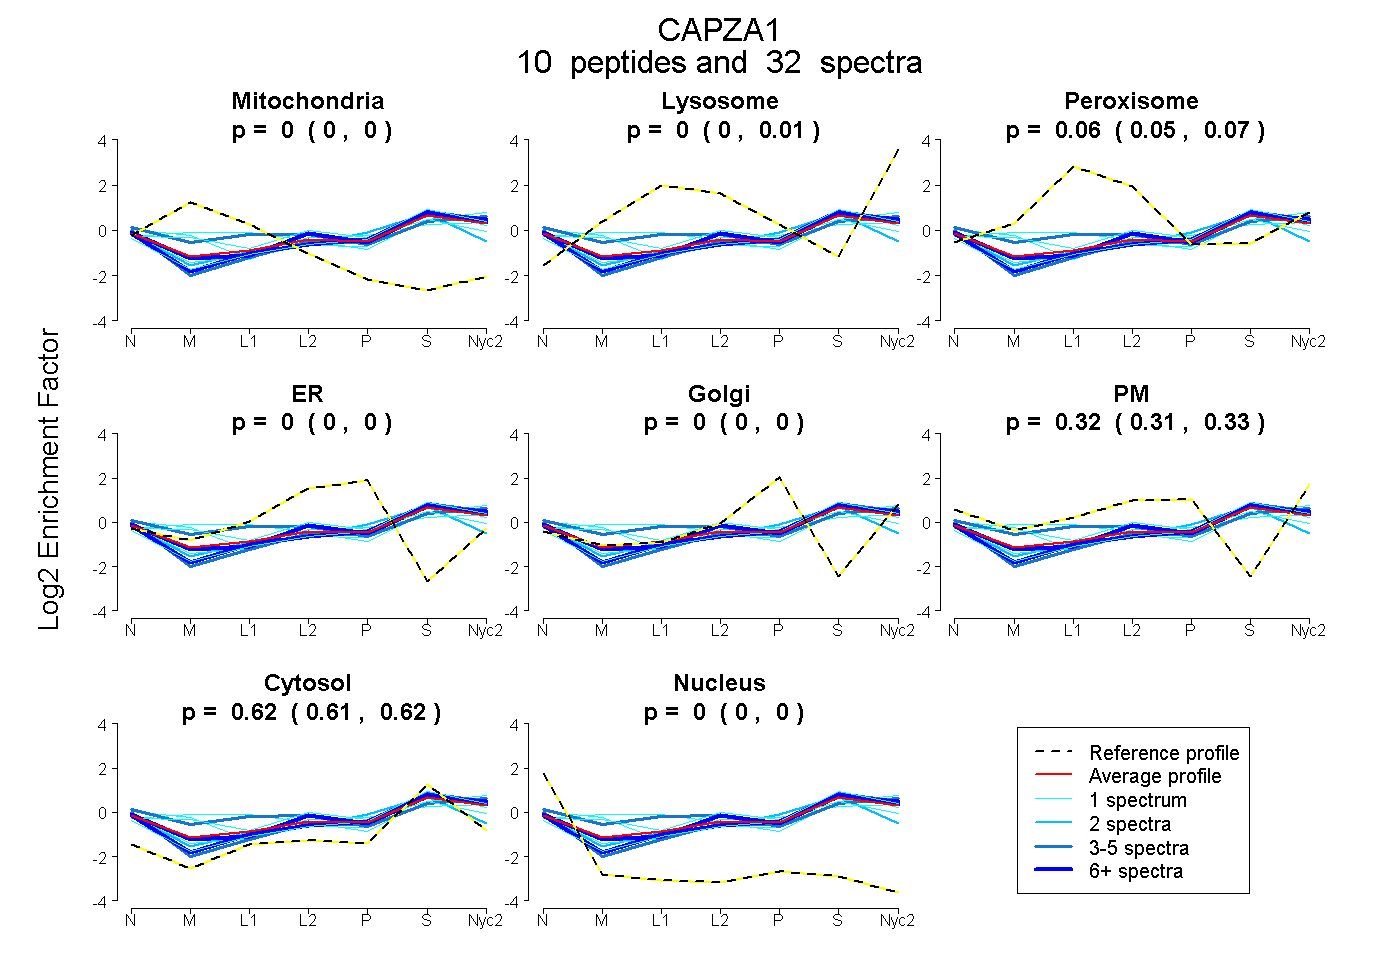
| Expt A |
10 peptides |
32 spectra |
|
0.000 0.000 | 0.000 |
0.000 0.000 | 0.007 |
0.061 0.050 | 0.070 |
0.000 0.000 | 0.000 |
0.000 0.000 | 0.000 |
0.322 0.314 | 0.328 |
0.616 0.609 | 0.622 |
0.000 0.000 | 0.000 |
| 1 spectrum, QLPLSR | 0.064 | 0.000 | 0.139 | 0.000 | 0.000 | 0.286 | 0.511 | 0.000 | ||
| 1 spectrum, FDHLR | 0.000 | 0.004 | 0.003 | 0.000 | 0.000 | 0.290 | 0.703 | 0.000 | ||
| 2 spectra, DSCDSALR | 0.000 | 0.000 | 0.007 | 0.080 | 0.000 | 0.228 | 0.685 | 0.001 | ||
| 1 spectrum, VSDEEK | 0.000 | 0.039 | 0.000 | 0.000 | 0.000 | 0.257 | 0.704 | 0.000 | ||
| 8 spectra, QLPVTR | 0.000 | 0.001 | 0.000 | 0.000 | 0.000 | 0.312 | 0.687 | 0.000 | ||
| 4 spectra, FITHAPPGEFNEVFNDVR | 0.016 | 0.018 | 0.217 | 0.000 | 0.000 | 0.281 | 0.468 | 0.000 | ||
| 8 spectra, NFWNGR | 0.000 | 0.045 | 0.012 | 0.000 | 0.000 | 0.321 | 0.621 | 0.000 | ||
| 1 spectrum, EASDPQPEDVDGGLK | 0.076 | 0.000 | 0.000 | 0.000 | 0.000 | 0.424 | 0.500 | 0.000 | ||
| 1 spectrum, EGAAHAFAQYNMDQFTPVK | 0.142 | 0.261 | 0.071 | 0.000 | 0.000 | 0.074 | 0.453 | 0.000 | ||
| 5 spectra, LLLNNDNLLR | 0.000 | 0.000 | 0.000 | 0.000 | 0.000 | 0.308 | 0.692 | 0.000 |
| Plot | Mito | Lyso or Perox | ER | Golgi | PM | Cytosol | Nucleus | ||||||
| Expt B |
1 peptide |
7 spectra |
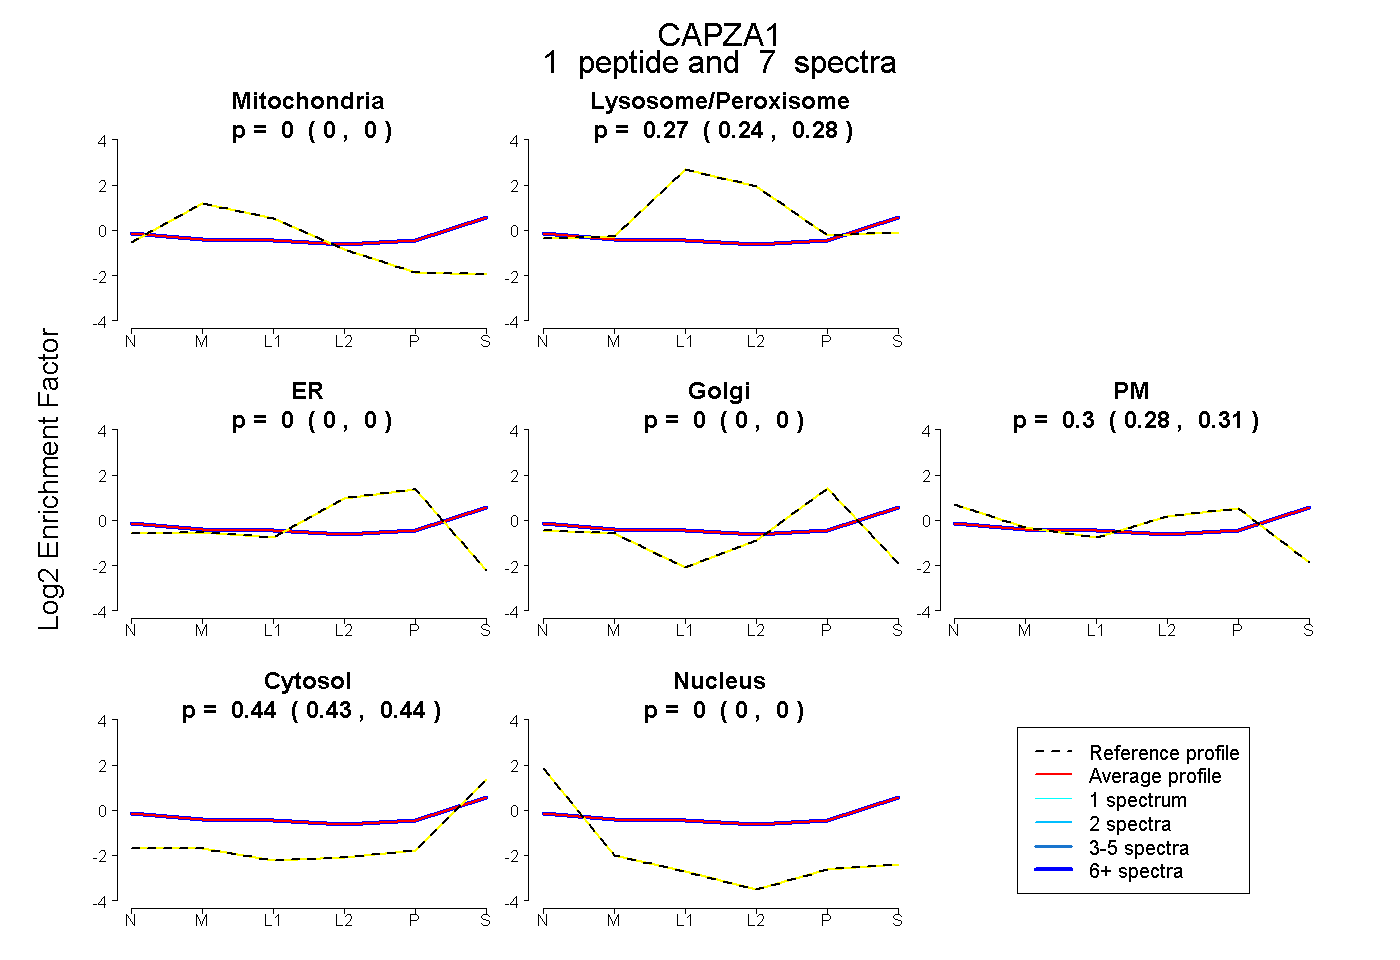 |
0.000 0.000 | 0.003 |
0.266 0.244 | 0.284 |
0.000 0.000 | 0.000 |
0.000 0.000 | 0.000 |
0.297 0.278 | 0.311 |
0.437 0.428 | 0.445 |
0.000 0.000 | 0.000 |
|||
| Plot | Lyso | Other | |||||||||||
| Expt C |
7 peptides |
35 spectra |
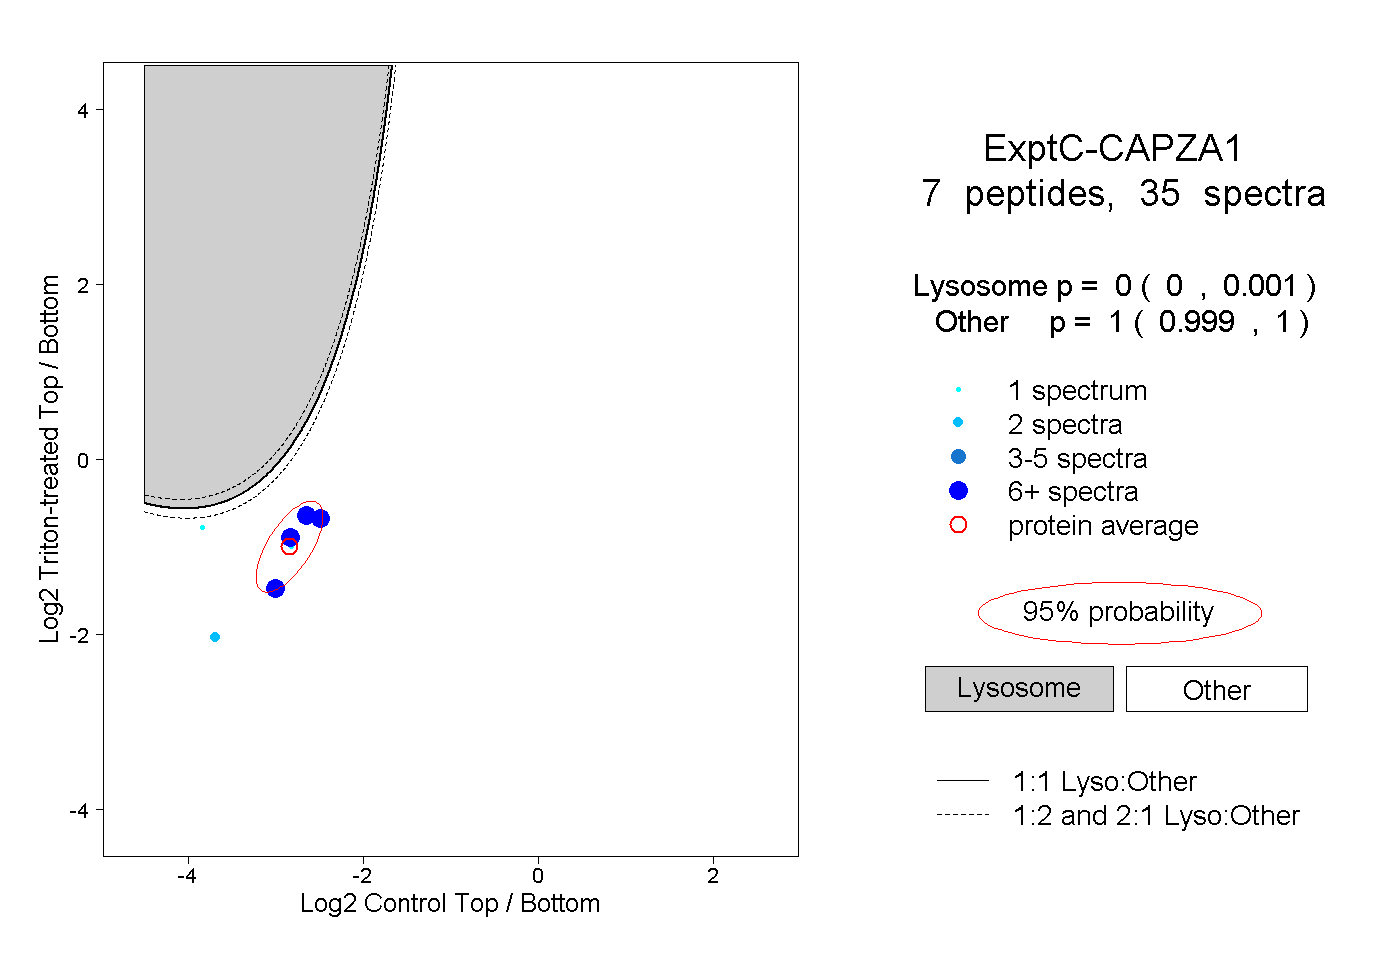 |
0.000 0.000 | 0.001 |
1.000 0.999 | 1.000 |
||||||||
| Plot | Lyso | Other | |||||||||||
| Expt D |
2 peptides |
3 spectra |
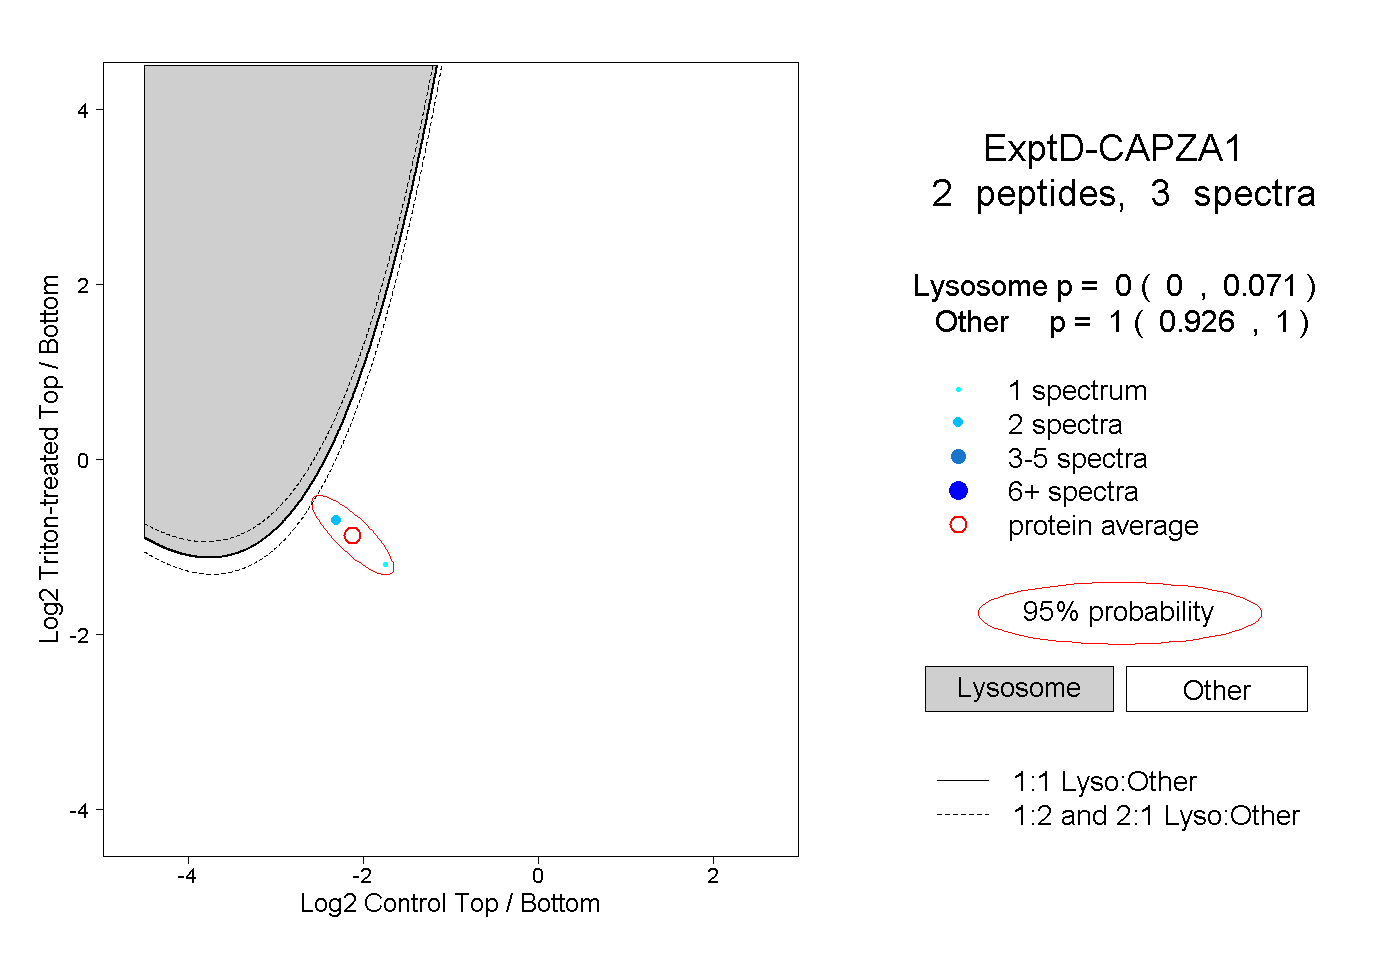 |
0.000 0.000 | 0.071 |
1.000 0.926 | 1.000 |