 6
6peptides
spectra
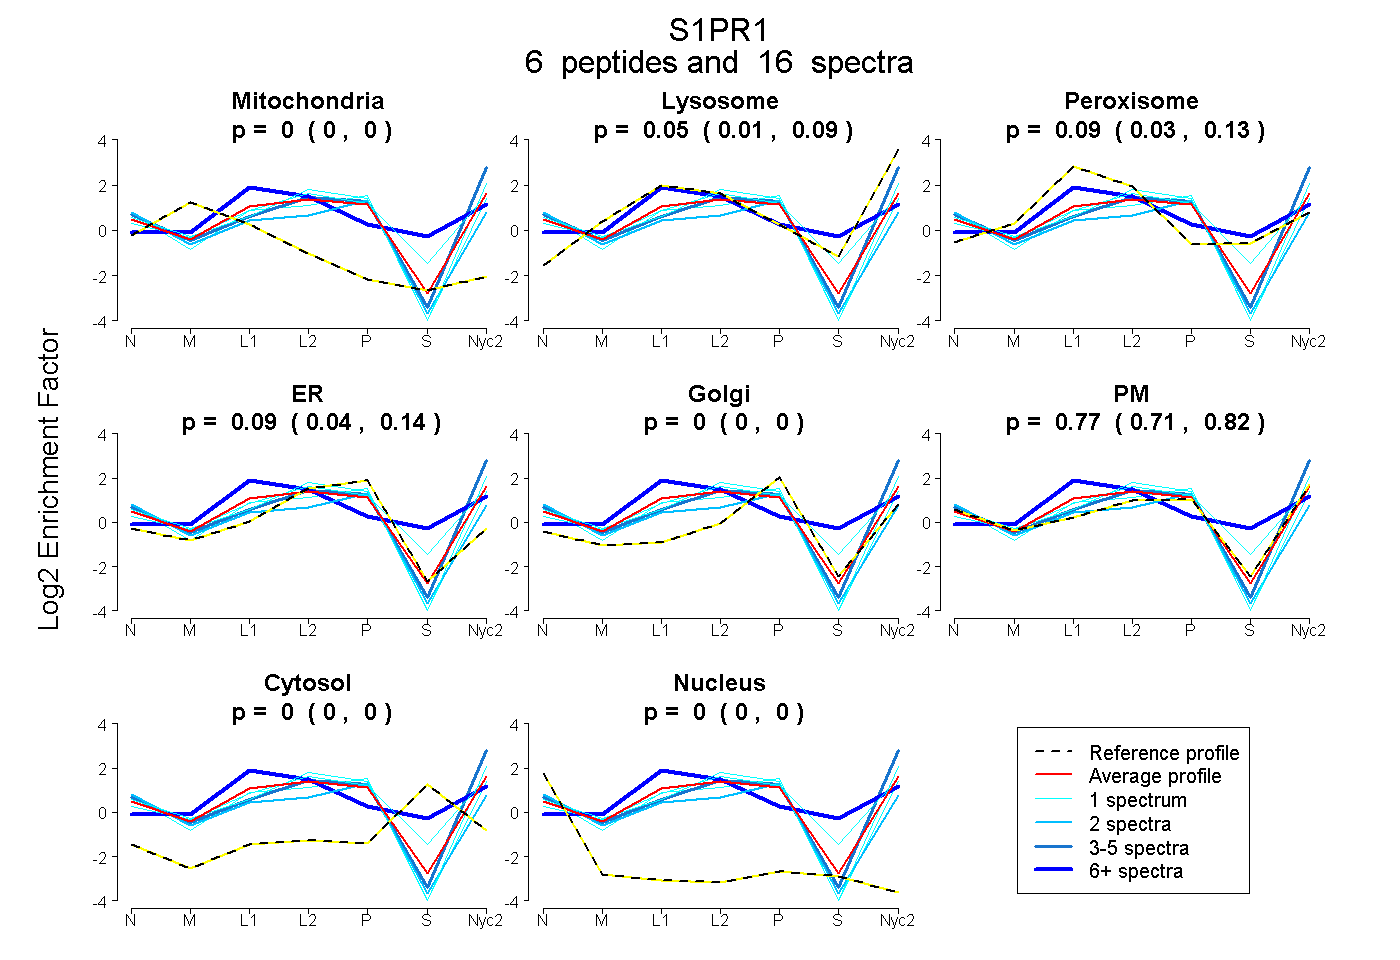
0.000 | 0.000
0.008 | 0.086
0.030 | 0.133
0.044 | 0.135
0.000 | 0.000
0.710 | 0.820
0.000 | 0.000
0.000 | 0.000
6peptides
spectra
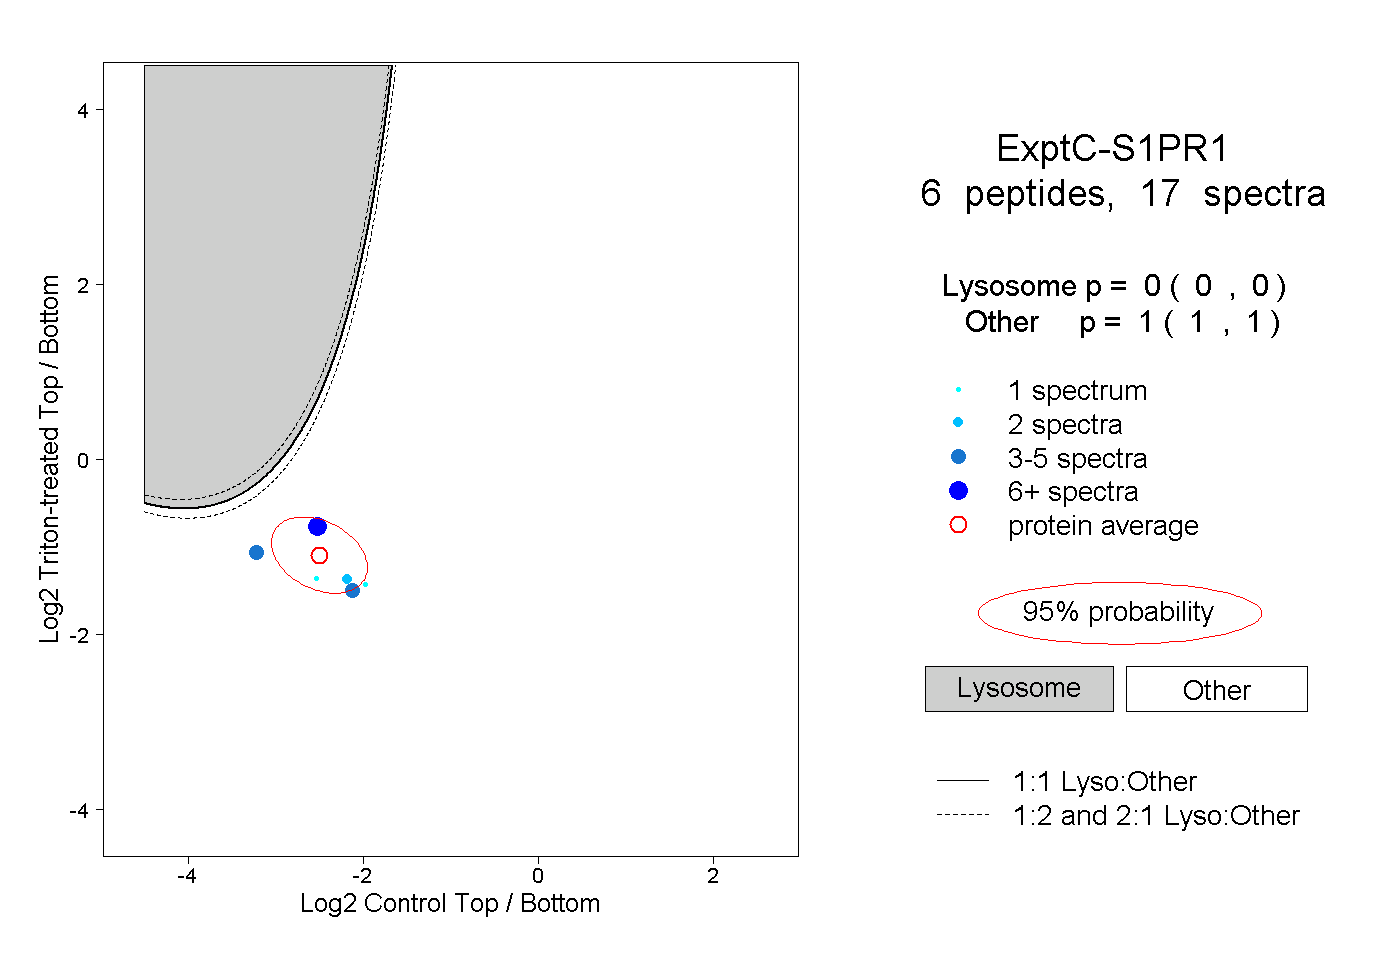
0.000 | 0.000
1.000 | 1.000
1peptide
spectrum
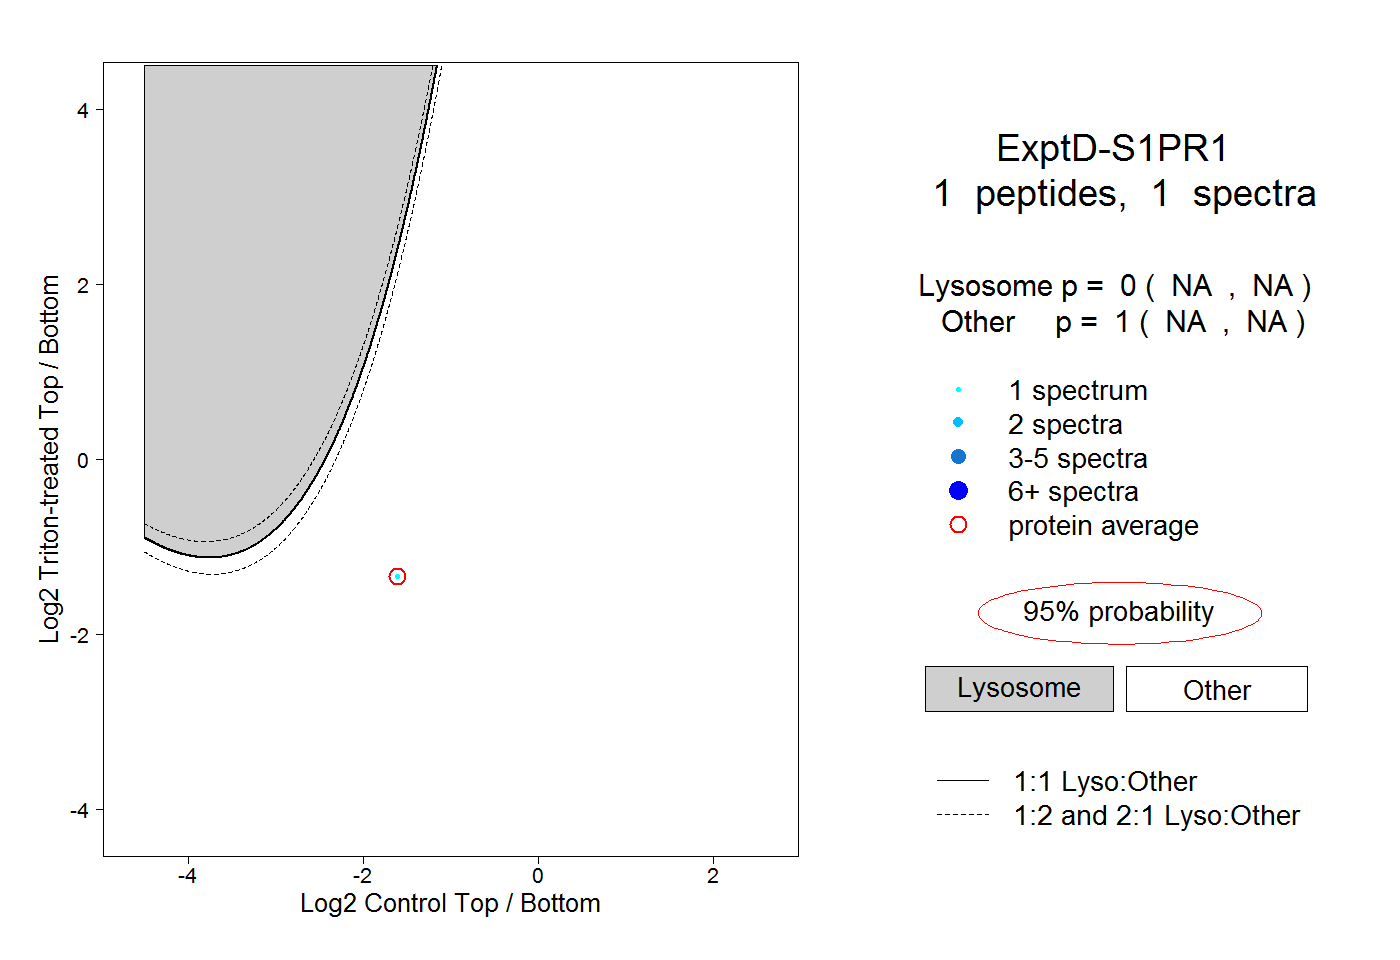
NA | NA
NA | NA