 6
6peptides
spectra
0.000 | 0.000
0.008 | 0.086
0.030 | 0.133
0.044 | 0.135
0.000 | 0.000
0.710 | 0.820
0.000 | 0.000
0.000 | 0.000
6peptides
spectra
0.000 | 0.000
1.000 | 1.000
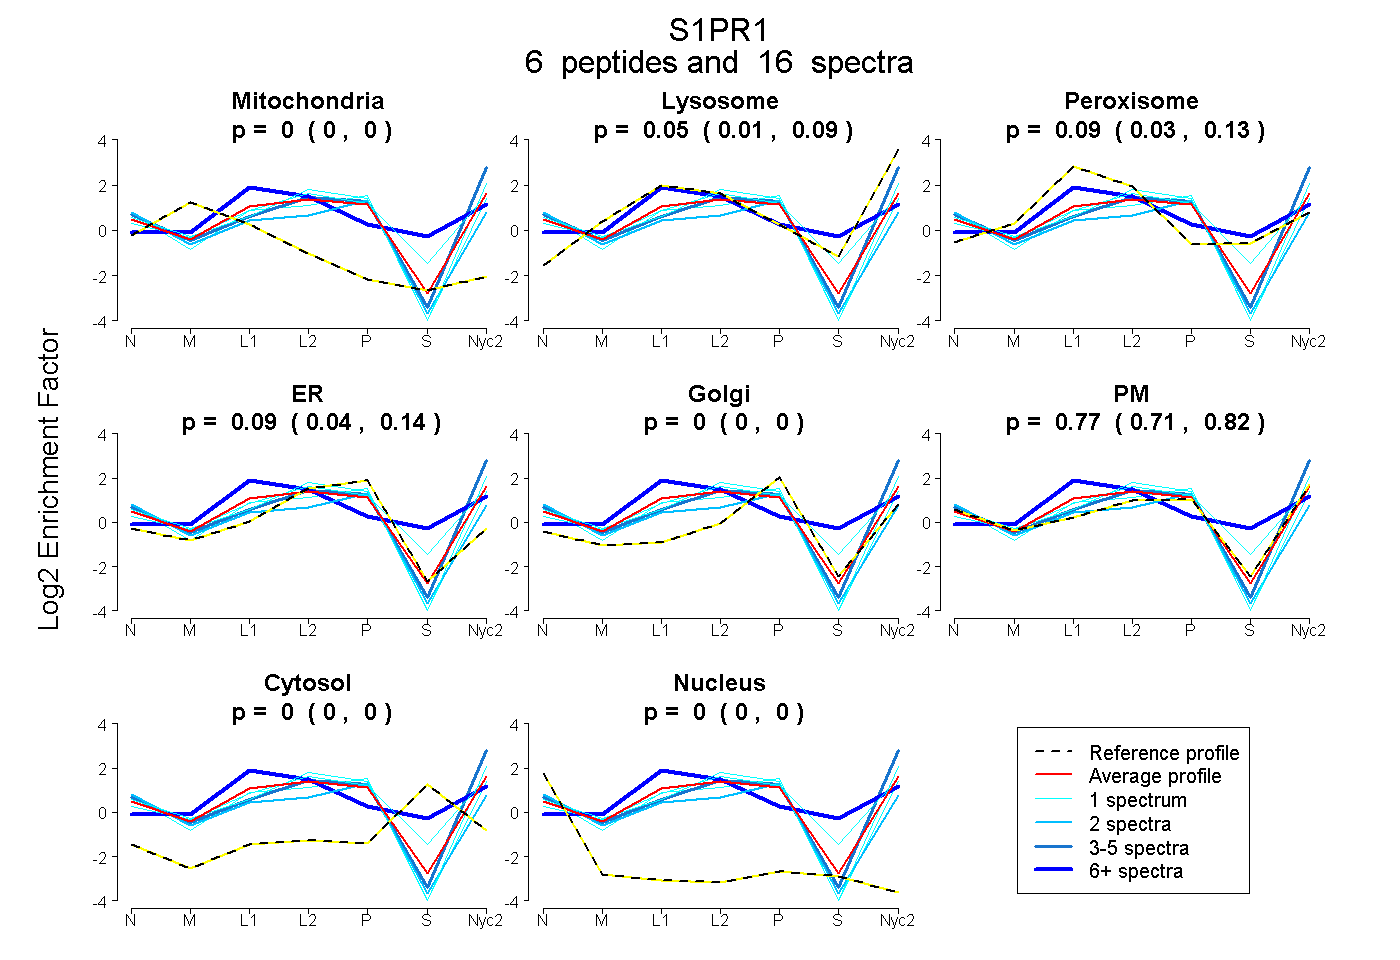
| Plot | Mito | Lyso | Perox | ER | Golgi | PM | Cytosol | Nucleus | |||||
| Expt A |
6 peptides |
16 spectra |
|
0.000 0.000 | 0.000 |
0.049 0.008 | 0.086 |
0.087 0.030 | 0.133 |
0.093 0.044 | 0.135 |
0.000 0.000 | 0.000 |
0.770 0.710 | 0.820 |
0.000 0.000 | 0.000 |
0.000 0.000 | 0.000 |
||
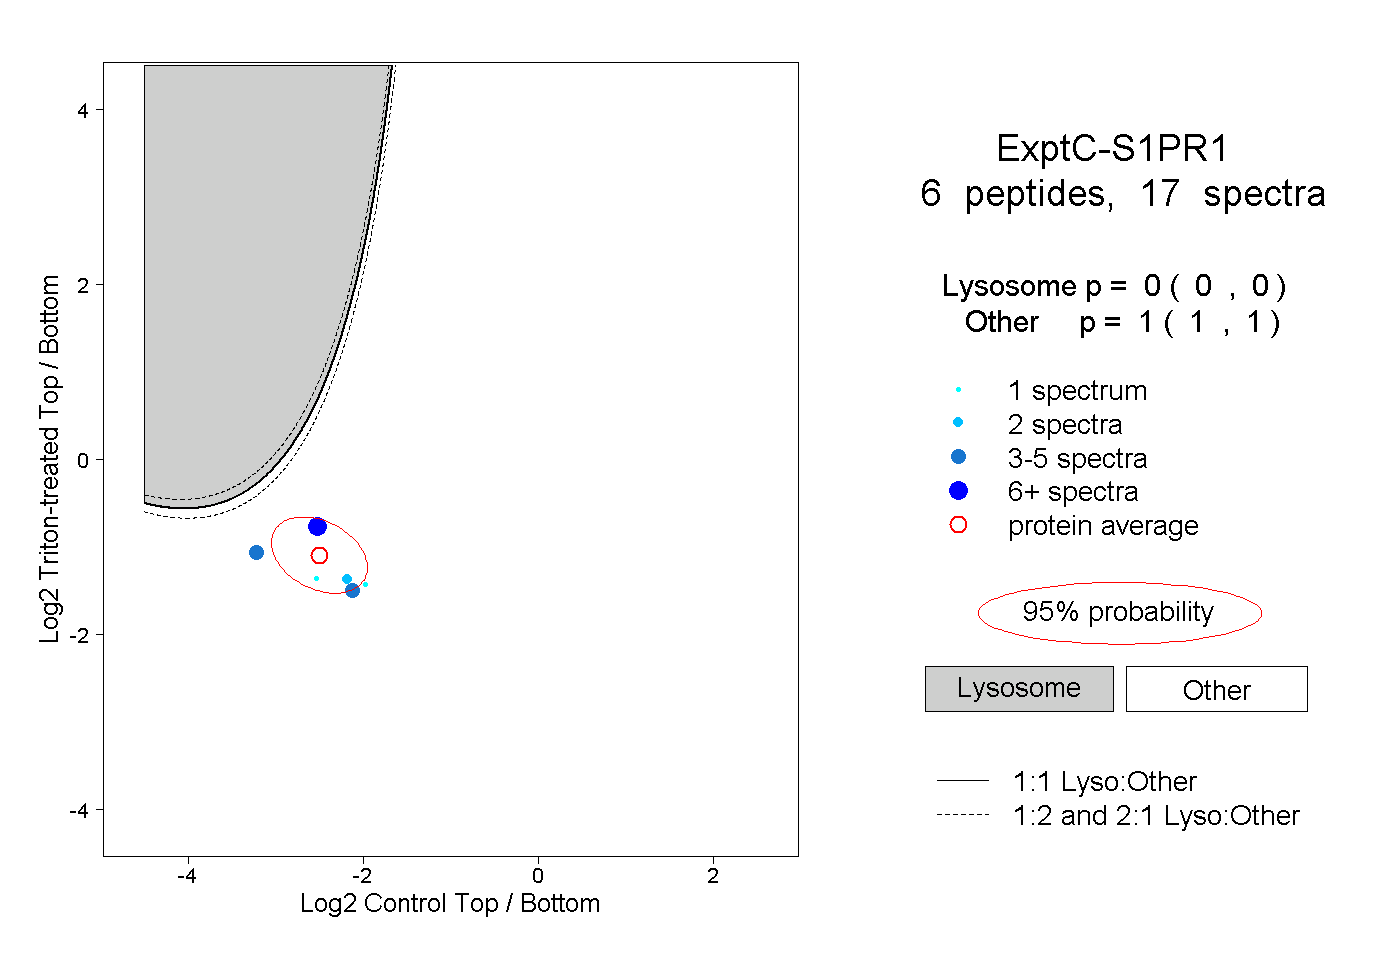
| Plot | Lyso | Other | |||||||||||
| Expt C |
6 peptides |
17 spectra |
|
0.000 0.000 | 0.000 |
1.000 1.000 | 1.000 |
| 2 spectra, TCDILYK | 0.000 | 1.000 | ||||||||
| 7 spectra, LTPAQWFLR | 0.000 | 1.000 | ||||||||
| 1 spectrum, YITMLK | 0.000 | 1.000 | ||||||||
| 3 spectra, LNIGVEK | 0.000 | 1.000 | ||||||||
| 3 spectra, CPNGDSAGK | 0.000 | 1.000 | ||||||||
| 1 spectrum, IISCCK | 0.000 | 1.000 |
| Plot | Lyso | Other | |||||||||||
| Expt D |
1 peptide |
1 spectrum |
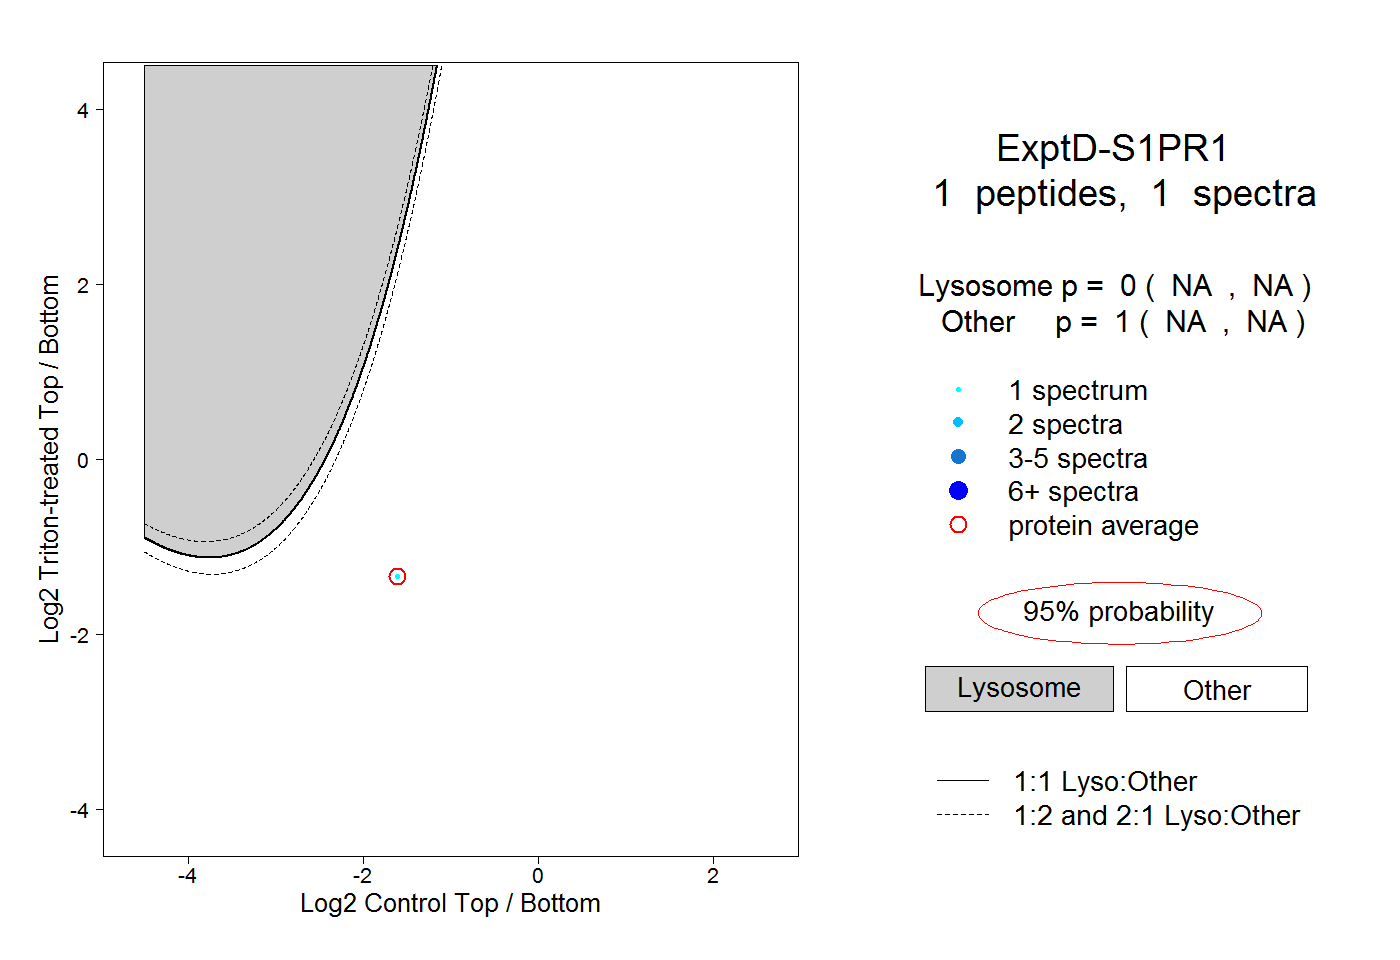 |
0.000 NA | NA |
1.000 NA | NA |