 15
15peptides
spectra
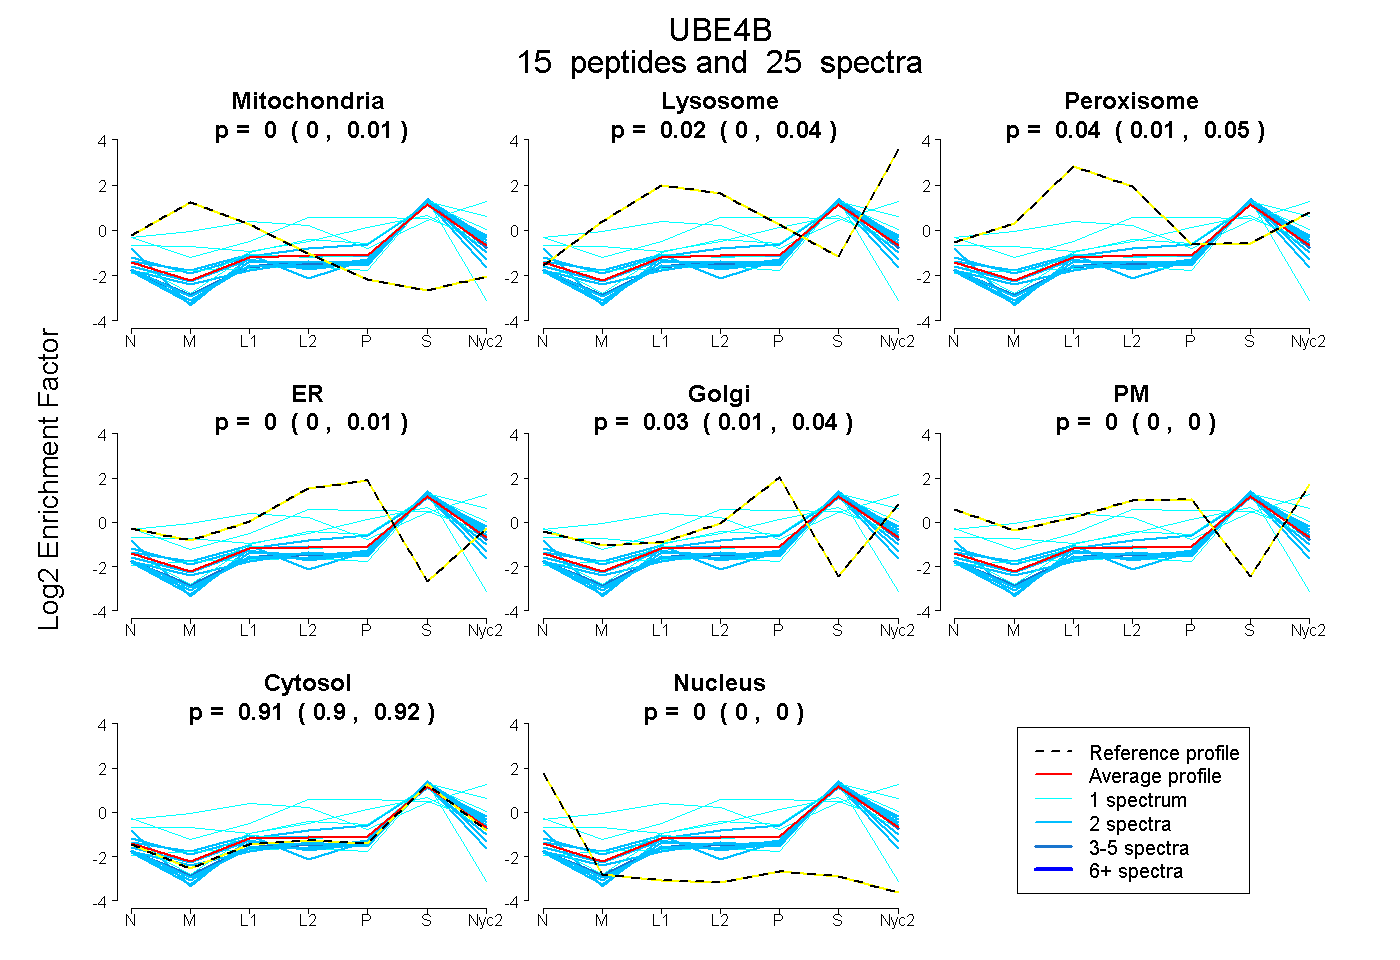
0.000 | 0.009
0.000 | 0.040
0.012 | 0.052
0.000 | 0.010
0.010 | 0.039
0.000 | 0.000
0.903 | 0.922
0.000 | 0.000
2peptides
spectra
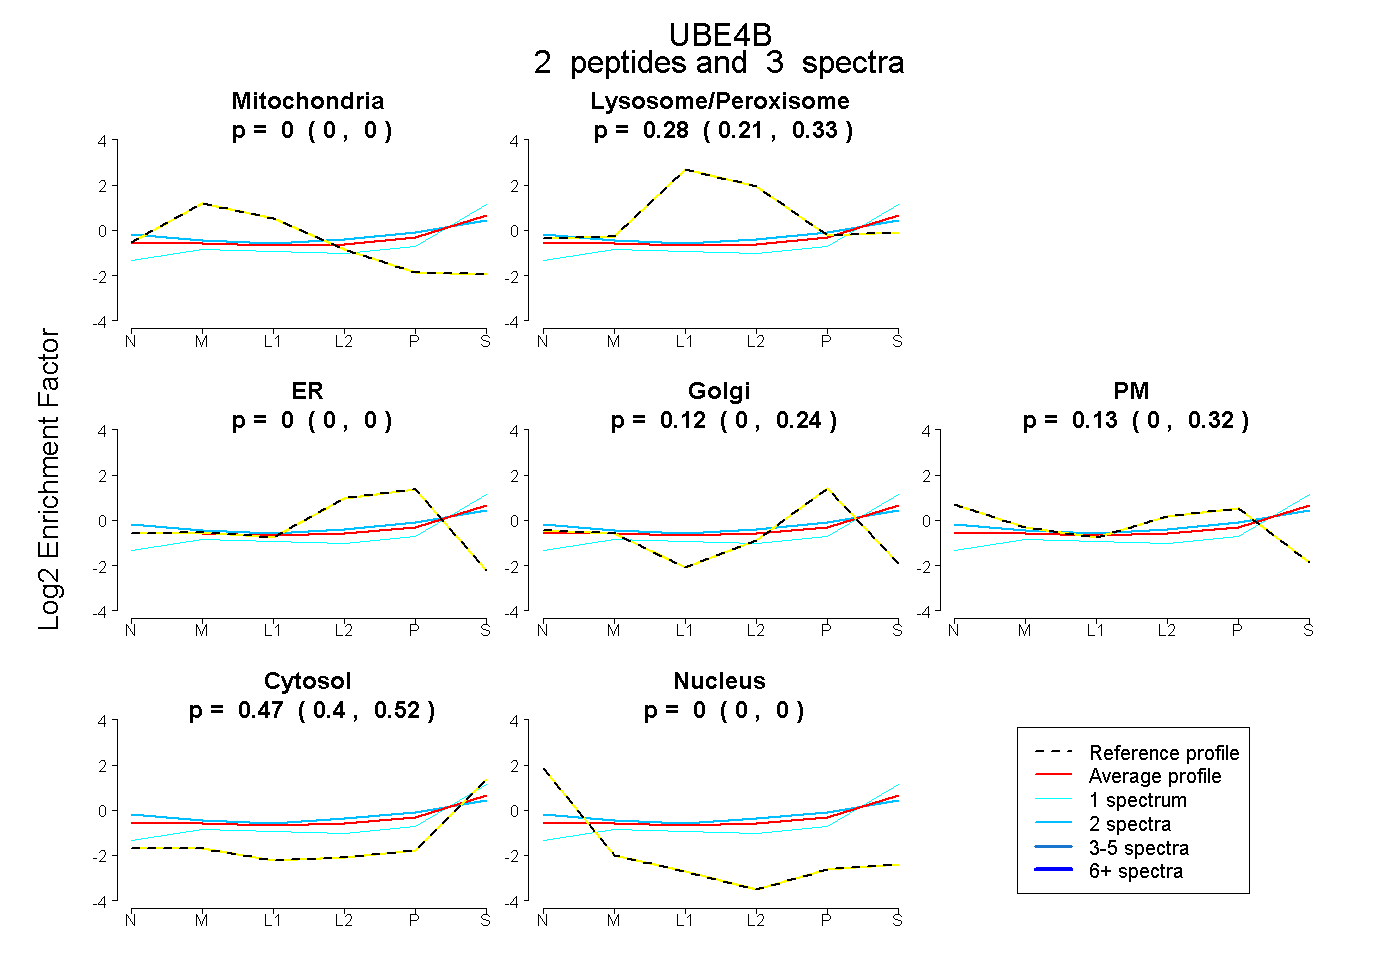
0.000 | 0.000
0.206 | 0.333
0.000 | 0.000
0.000 | 0.243
0.000 | 0.324
0.403 | 0.516
0.000 | 0.000
7peptides
spectra
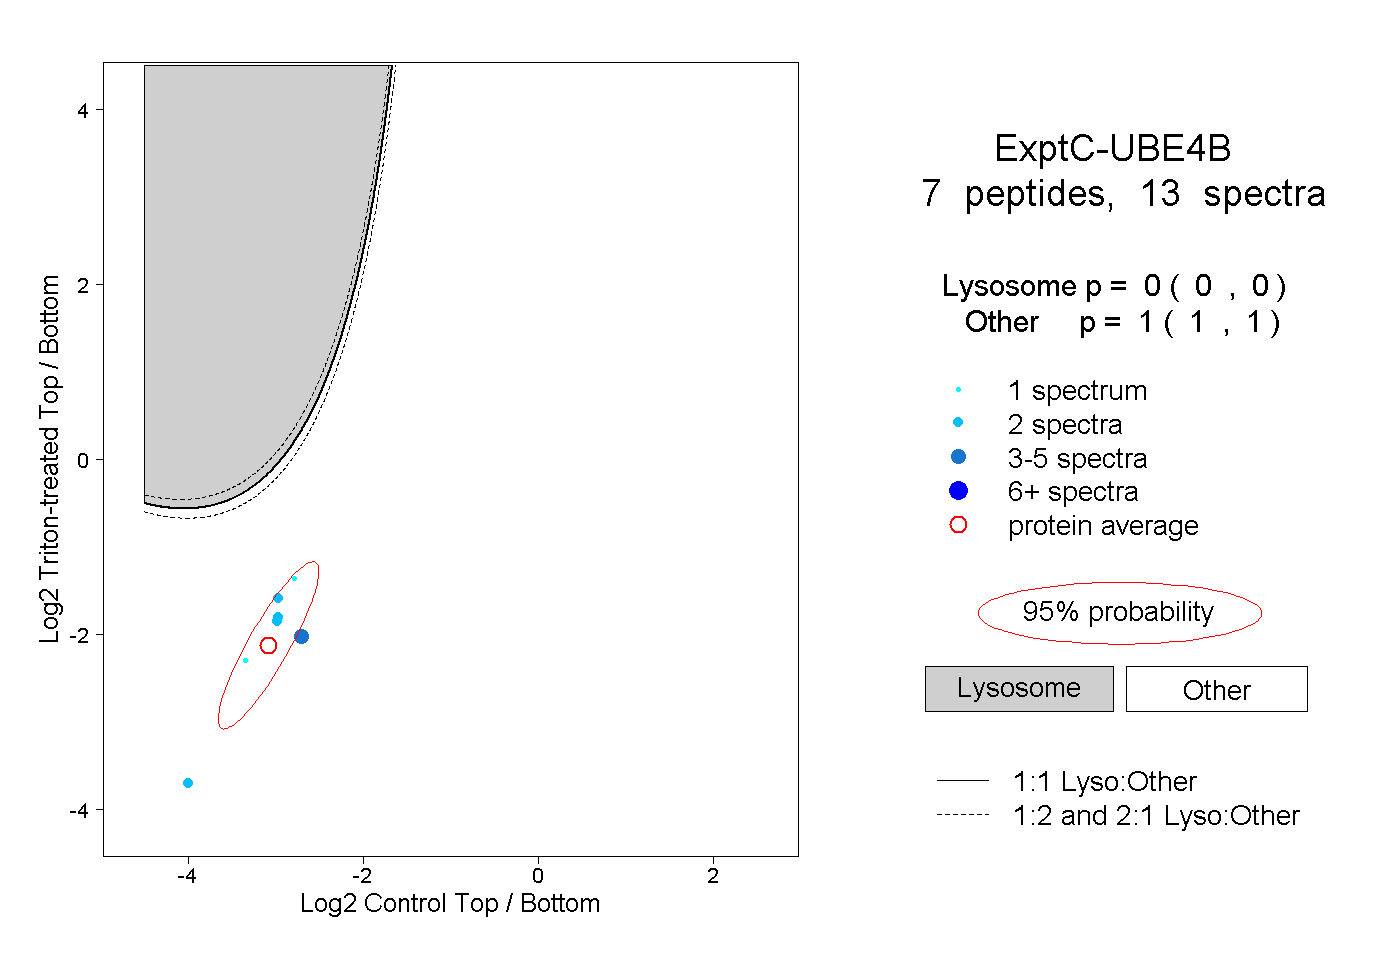
0.000 | 0.000
1.000 | 1.000