 25
25peptides
spectra
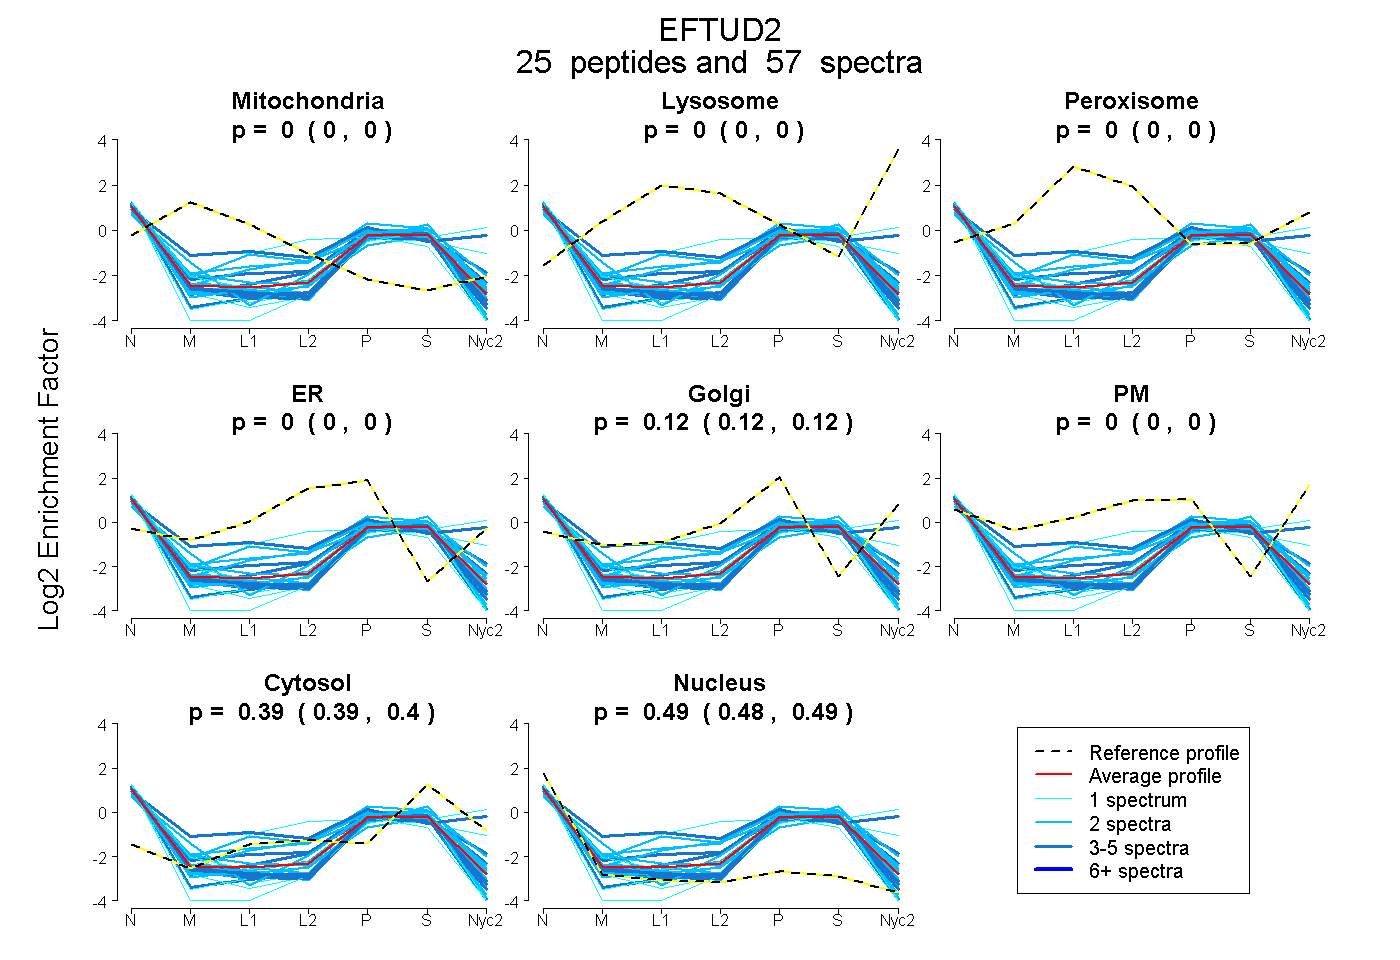
0.000 | 0.000
0.000 | 0.000
0.000 | 0.000
0.000 | 0.000
0.116 | 0.124
0.000 | 0.000
0.390 | 0.395
0.481 | 0.491
4peptides
spectra
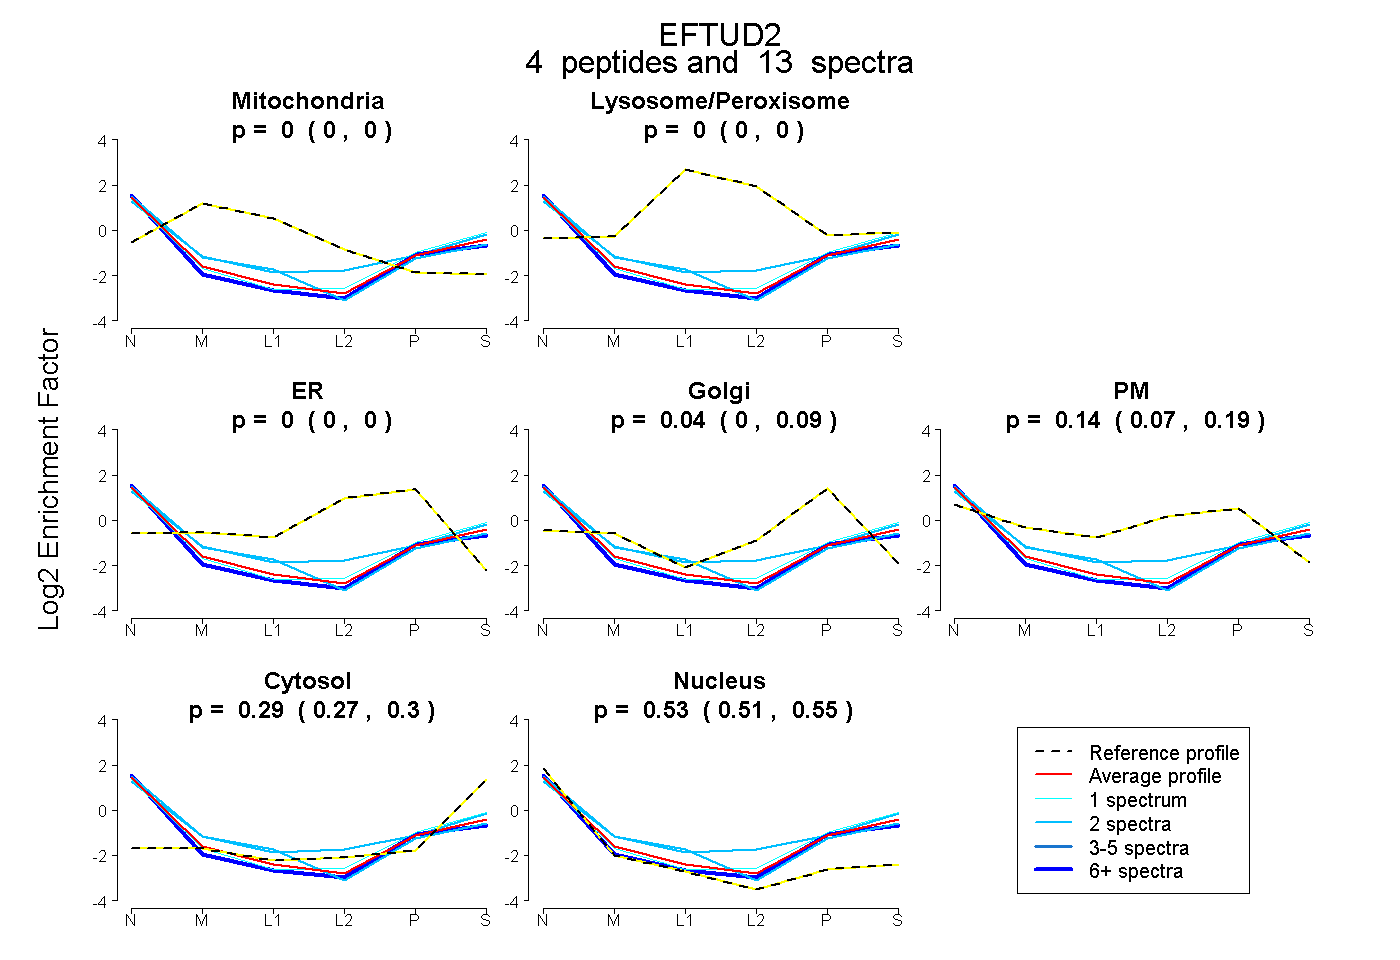
0.000 | 0.000
0.000 | 0.000
0.000 | 0.000
0.000 | 0.091
0.074 | 0.190
0.271 | 0.300
0.506 | 0.548
7peptides
spectra
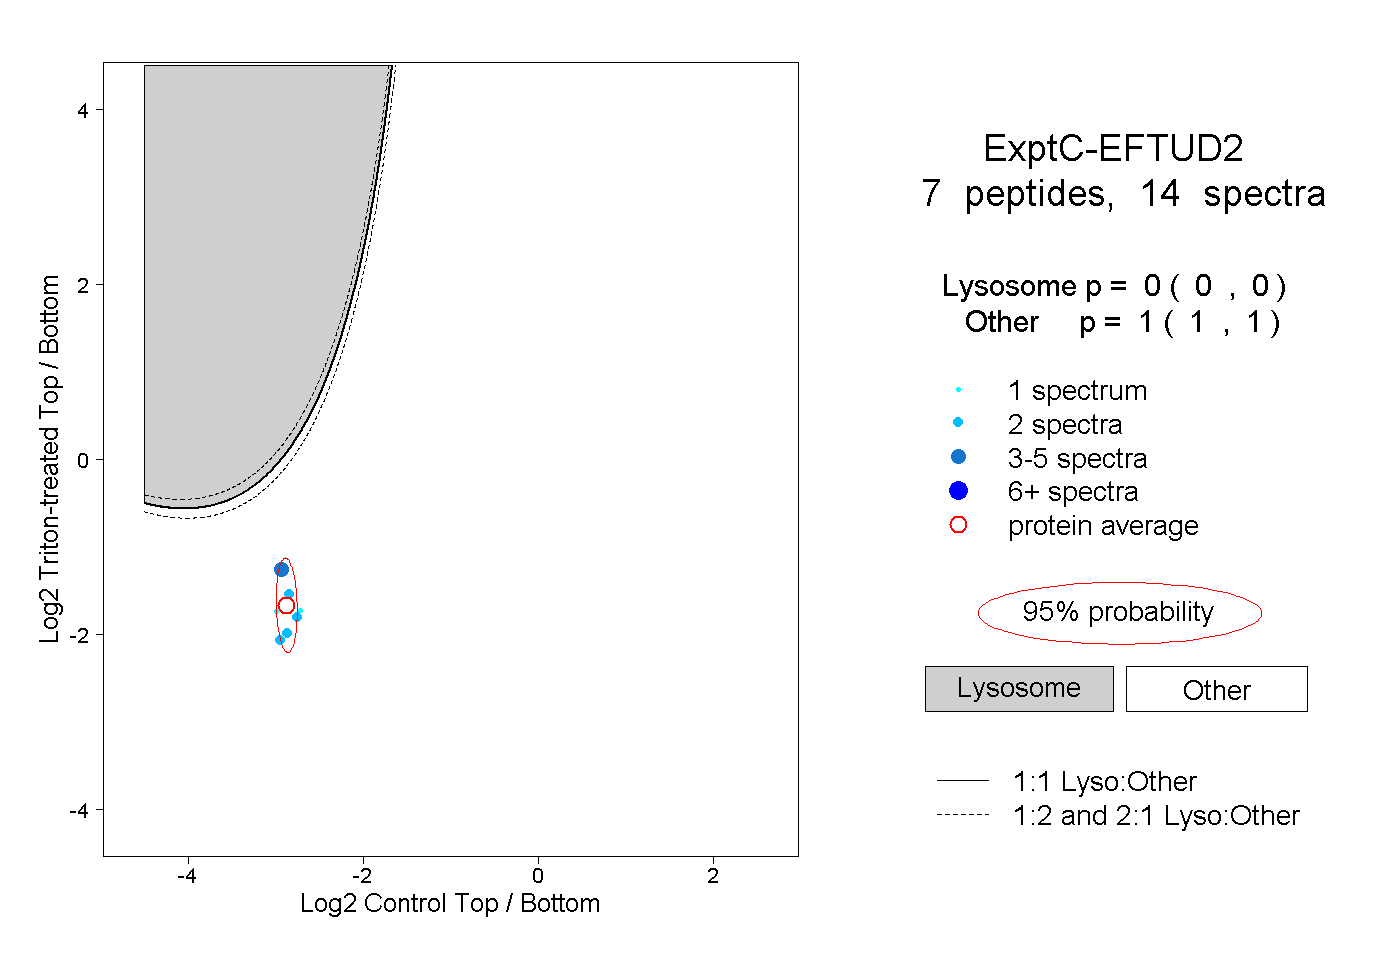
0.000 | 0.000
1.000 | 1.000
1peptide
spectrum
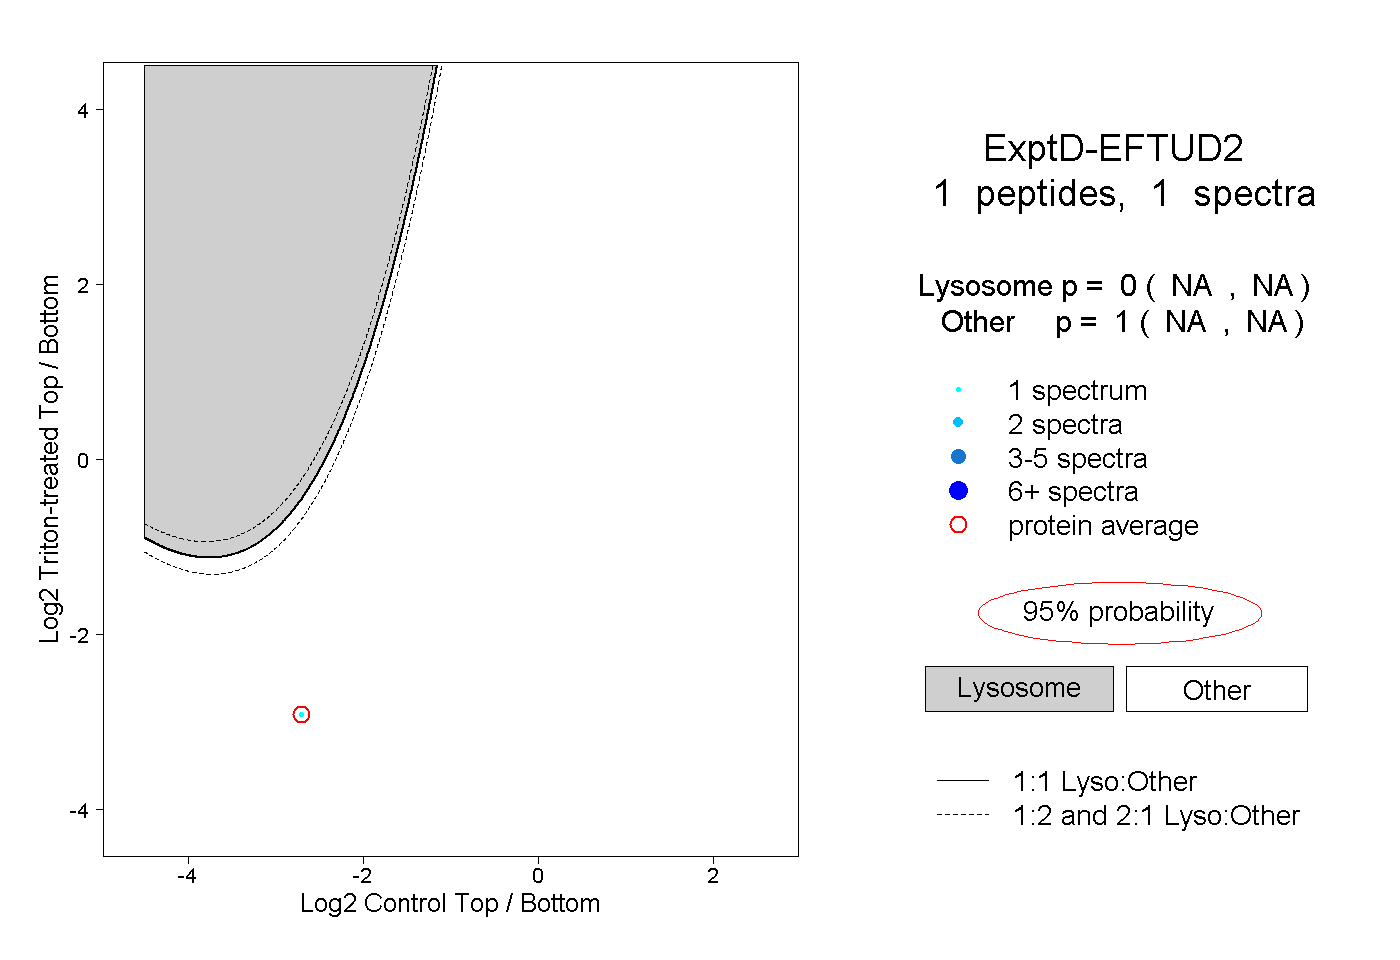
NA | NA
NA | NA