 25
25peptides
spectra
0.000 | 0.000
0.000 | 0.000
0.000 | 0.000
0.000 | 0.000
0.116 | 0.124
0.000 | 0.000
0.390 | 0.395
0.481 | 0.491
| Plot | Mito | Lyso | Perox | ER | Golgi | PM | Cytosol | Nucleus | |||||
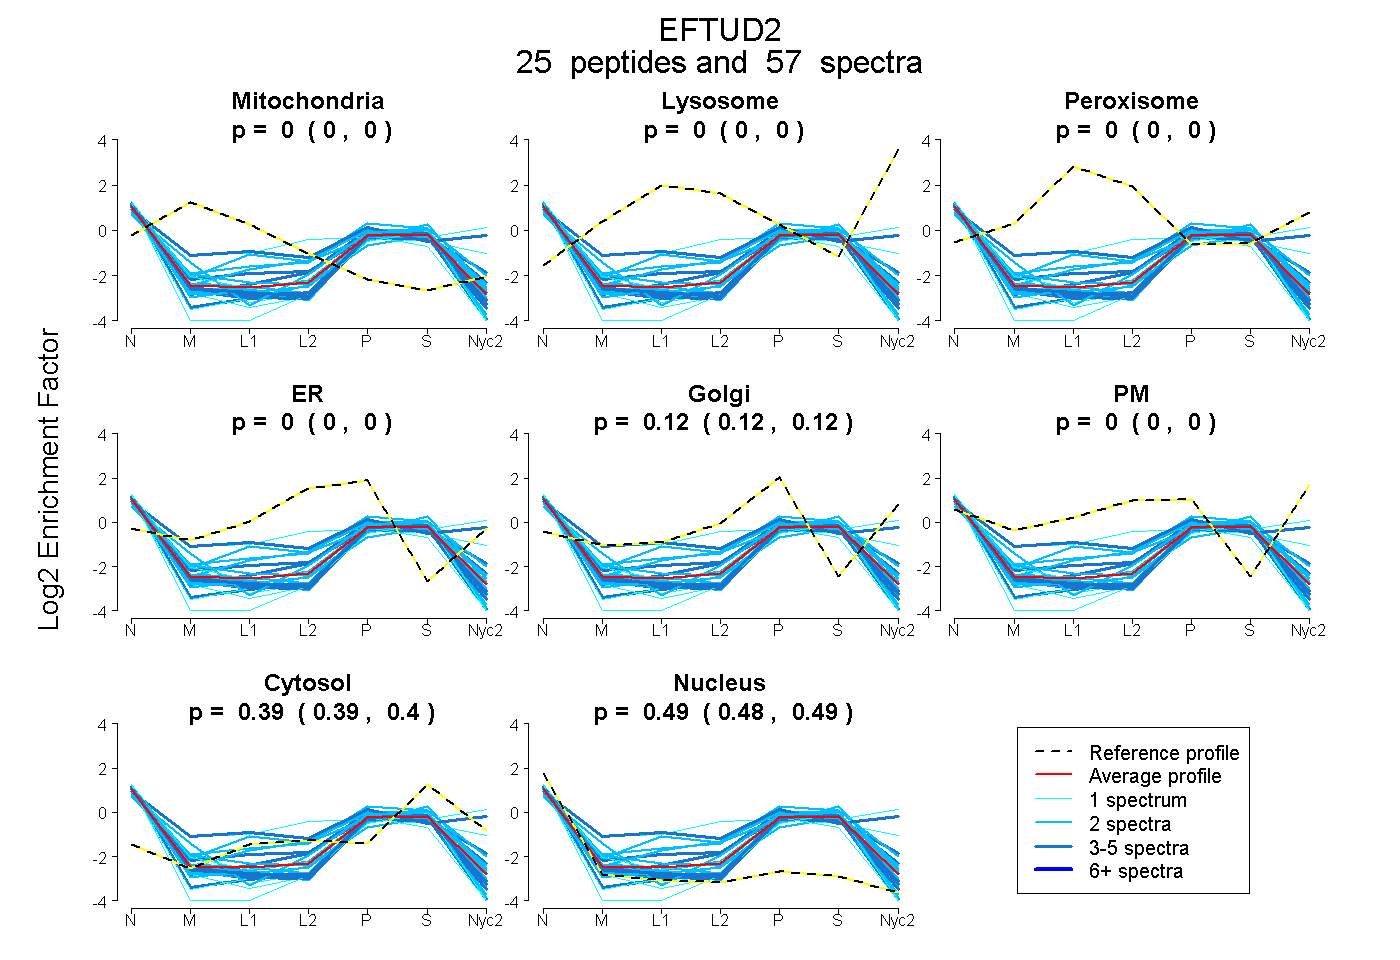
| Expt A |
25 peptides |
57 spectra |
|
0.000 0.000 | 0.000 |
0.000 0.000 | 0.000 |
0.000 0.000 | 0.000 |
0.000 0.000 | 0.000 |
0.121 0.116 | 0.124 |
0.000 0.000 | 0.000 |
0.393 0.390 | 0.395 |
0.487 0.481 | 0.491 |
| 1 spectrum, VADPVVTFCETVVETSSLK | 0.000 | 0.000 | 0.000 | 0.000 | 0.000 | 0.000 | 0.327 | 0.673 | ||
| 3 spectra, LNIRPLLR | 0.000 | 0.000 | 0.000 | 0.000 | 0.029 | 0.000 | 0.364 | 0.606 | ||
| 2 spectra, IYADTFGDINYQEFAK | 0.000 | 0.000 | 0.000 | 0.000 | 0.116 | 0.000 | 0.408 | 0.476 | ||
| 2 spectra, LWISVAR | 0.000 | 0.000 | 0.000 | 0.000 | 0.032 | 0.000 | 0.516 | 0.451 | ||
| 1 spectrum, ITMIAEPLEK | 0.000 | 0.000 | 0.000 | 0.000 | 0.000 | 0.000 | 0.366 | 0.634 | ||
| 2 spectra, DSIVQGFQWGTR | 0.000 | 0.000 | 0.000 | 0.000 | 0.019 | 0.000 | 0.376 | 0.604 | ||
| 4 spectra, FFDDPMLLELAK | 0.000 | 0.000 | 0.000 | 0.000 | 0.000 | 0.000 | 0.364 | 0.636 | ||
| 2 spectra, LLLELK | 0.000 | 0.000 | 0.000 | 0.000 | 0.021 | 0.000 | 0.400 | 0.579 | ||
| 5 spectra, EGPLCDELIR | 0.000 | 0.000 | 0.000 | 0.000 | 0.049 | 0.000 | 0.389 | 0.561 | ||
| 1 spectrum, MYSTDDGVQFHAFGR | 0.000 | 0.000 | 0.010 | 0.000 | 0.000 | 0.482 | 0.378 | 0.129 | ||
| 1 spectrum, GNEEAQIFRPLK | 0.000 | 0.000 | 0.000 | 0.000 | 0.000 | 0.000 | 0.388 | 0.612 | ||
| 2 spectra, TLDELGIHLTK | 0.000 | 0.000 | 0.000 | 0.002 | 0.066 | 0.000 | 0.445 | 0.487 | ||
| 2 spectra, LGEFFQTK | 0.000 | 0.000 | 0.000 | 0.006 | 0.000 | 0.000 | 0.375 | 0.619 | ||
| 4 spectra, YDWDLLAAR | 0.000 | 0.000 | 0.000 | 0.000 | 0.049 | 0.000 | 0.392 | 0.559 | ||
| 1 spectrum, VLSGTIHAGQPVK | 0.000 | 0.000 | 0.000 | 0.132 | 0.000 | 0.000 | 0.242 | 0.626 | ||
| 2 spectra, SYPSLTTK | 0.000 | 0.000 | 0.054 | 0.206 | 0.000 | 0.000 | 0.348 | 0.392 | ||
| 2 spectra, MLDGLR | 0.000 | 0.000 | 0.000 | 0.000 | 0.168 | 0.000 | 0.357 | 0.475 | ||
| 2 spectra, TCFVDCLIEQTHPEIR | 0.000 | 0.000 | 0.000 | 0.000 | 0.195 | 0.000 | 0.383 | 0.422 | ||
| 4 spectra, ALLGSVK | 0.000 | 0.000 | 0.000 | 0.000 | 0.183 | 0.000 | 0.399 | 0.418 | ||
| 3 spectra, TATITEPR | 0.000 | 0.000 | 0.000 | 0.000 | 0.025 | 0.447 | 0.350 | 0.179 | ||
| 2 spectra, NVTLCGHLHHGK | 0.000 | 0.000 | 0.000 | 0.176 | 0.000 | 0.000 | 0.387 | 0.437 | ||
| 3 spectra, SFVEFILEPLYK | 0.000 | 0.000 | 0.000 | 0.000 | 0.099 | 0.000 | 0.353 | 0.547 | ||
| 2 spectra, STPVTVVLPDTK | 0.000 | 0.000 | 0.000 | 0.193 | 0.084 | 0.000 | 0.452 | 0.272 | ||
| 3 spectra, FNTTSVIK | 0.000 | 0.000 | 0.000 | 0.004 | 0.237 | 0.000 | 0.379 | 0.380 | ||
| 1 spectrum, ILAQVVGDVDTSLPR | 0.000 | 0.000 | 0.000 | 0.000 | 0.239 | 0.000 | 0.320 | 0.440 |
| Plot | Mito | Lyso or Perox | ER | Golgi | PM | Cytosol | Nucleus | ||||||
| Expt B |
4 peptides |
13 spectra |
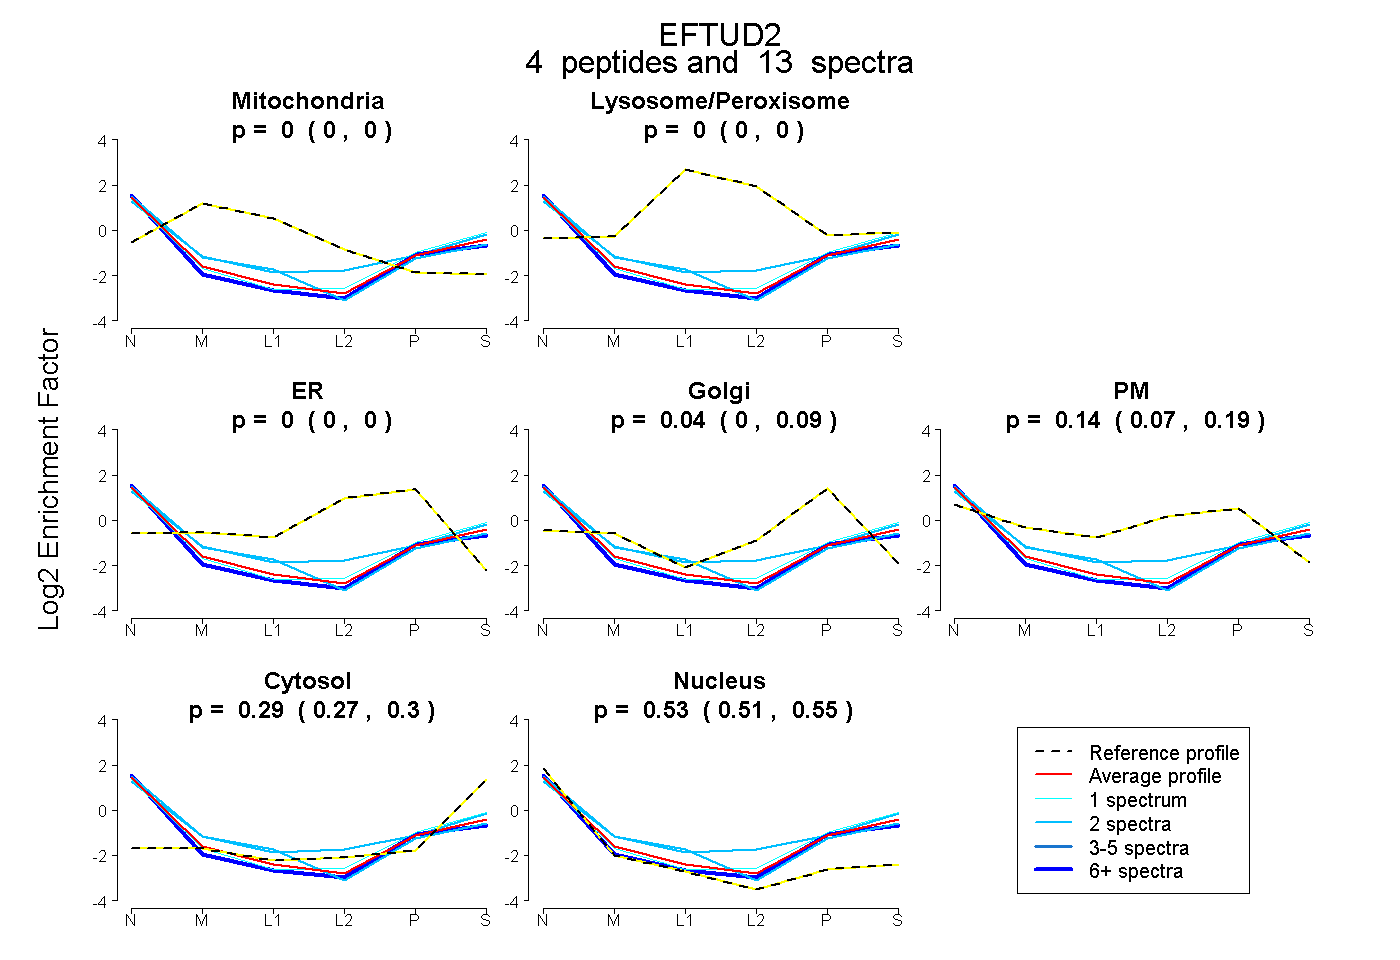 |
0.000 0.000 | 0.000 |
0.000 0.000 | 0.000 |
0.000 0.000 | 0.000 |
0.044 0.000 | 0.091 |
0.141 0.074 | 0.190 |
0.287 0.271 | 0.300 |
0.528 0.506 | 0.548 |
|||
| Plot | Lyso | Other | |||||||||||
| Expt C |
7 peptides |
14 spectra |
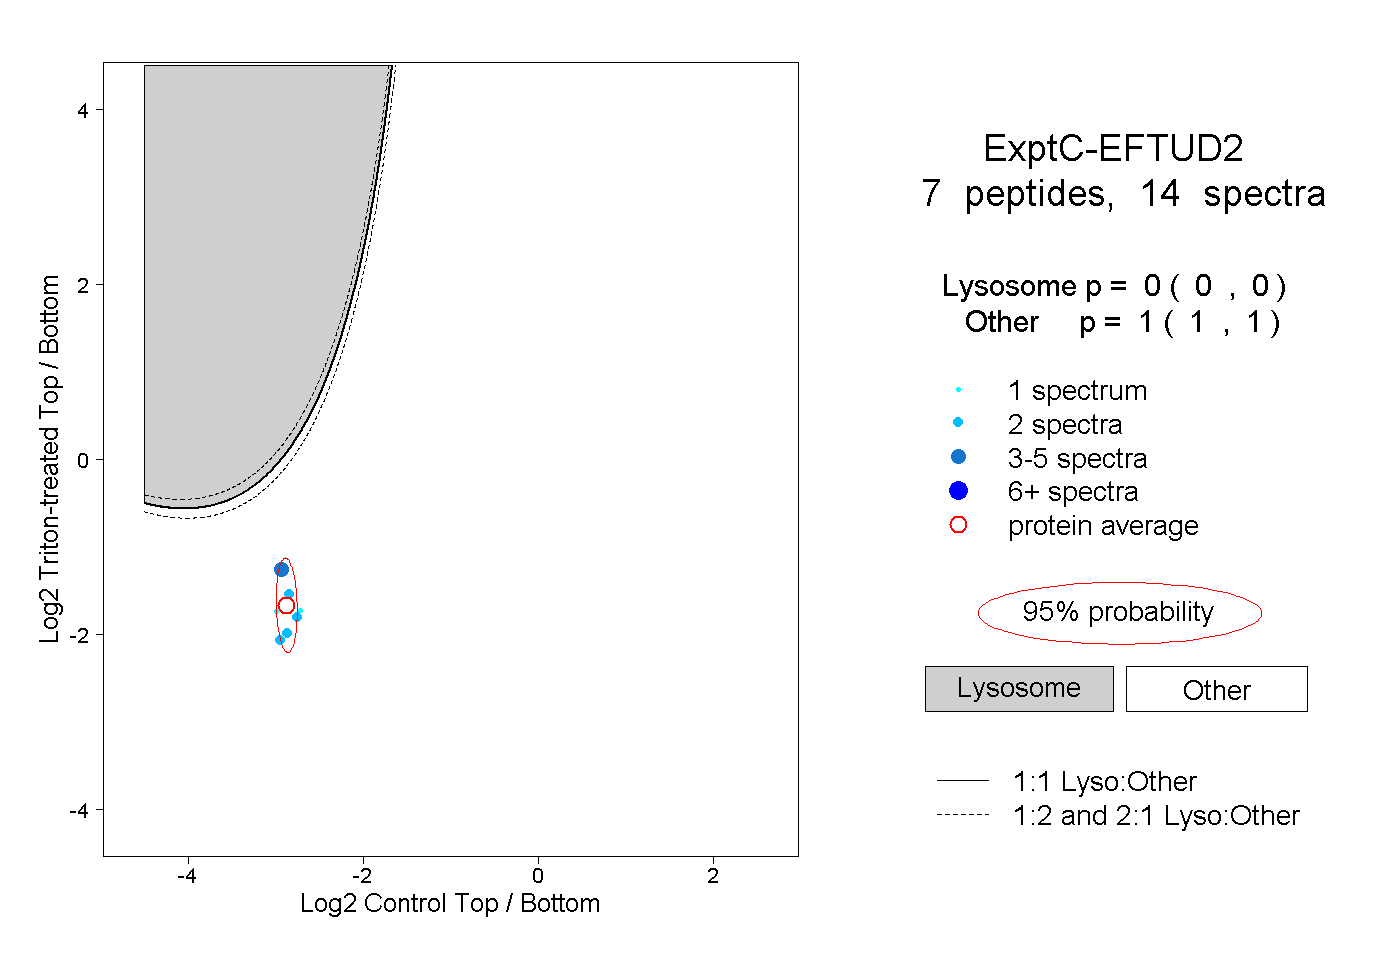 |
0.000 0.000 | 0.000 |
1.000 1.000 | 1.000 |
||||||||
| Plot | Lyso | Other | |||||||||||
| Expt D |
1 peptide |
1 spectrum |
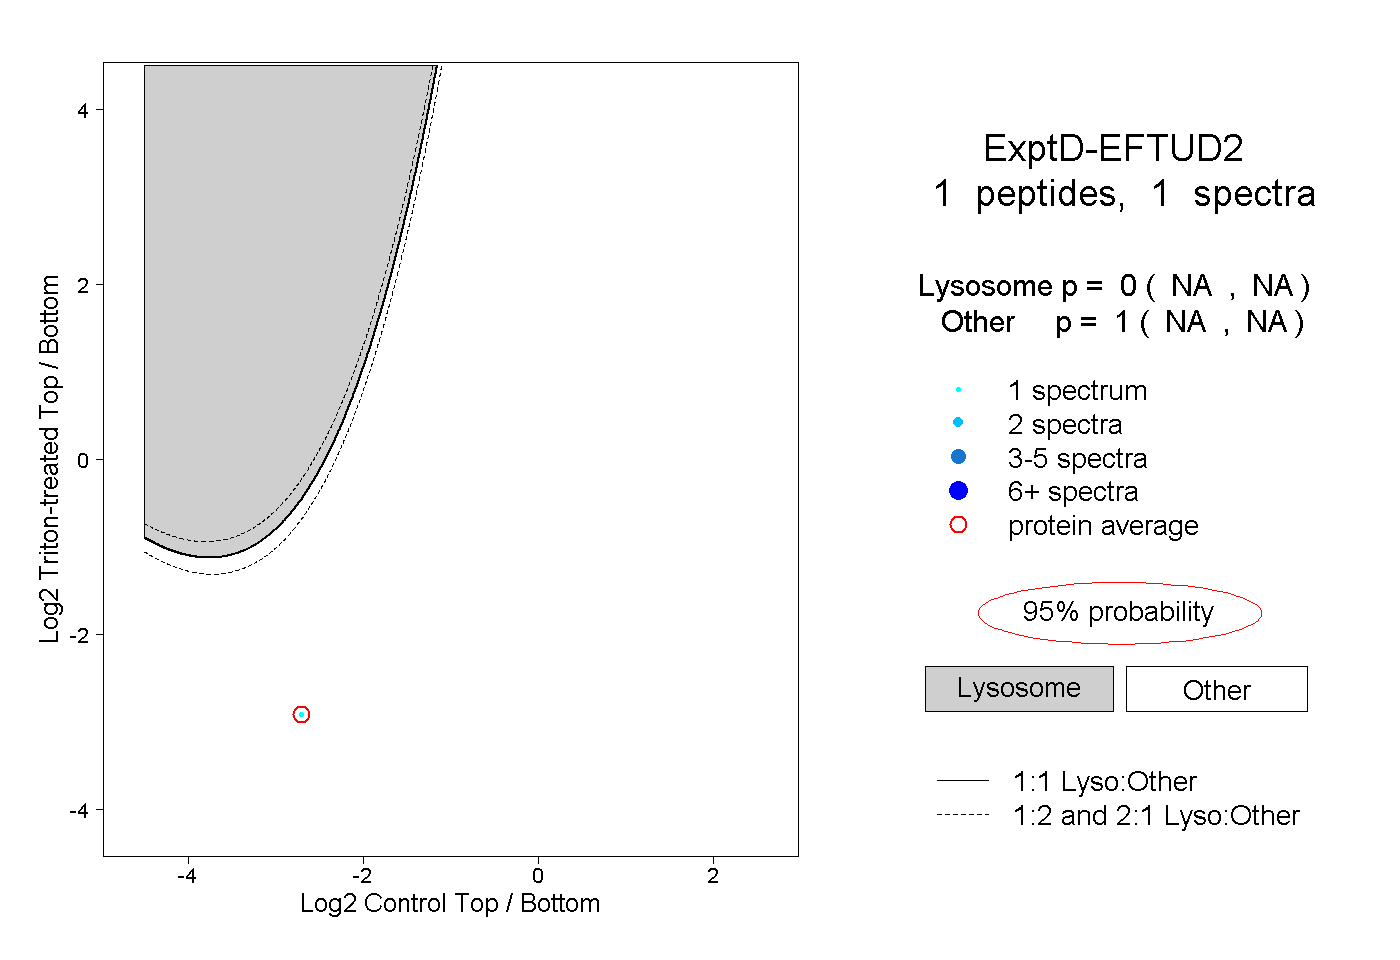 |
0.000 NA | NA |
1.000 NA | NA |