 5
5peptides
spectra
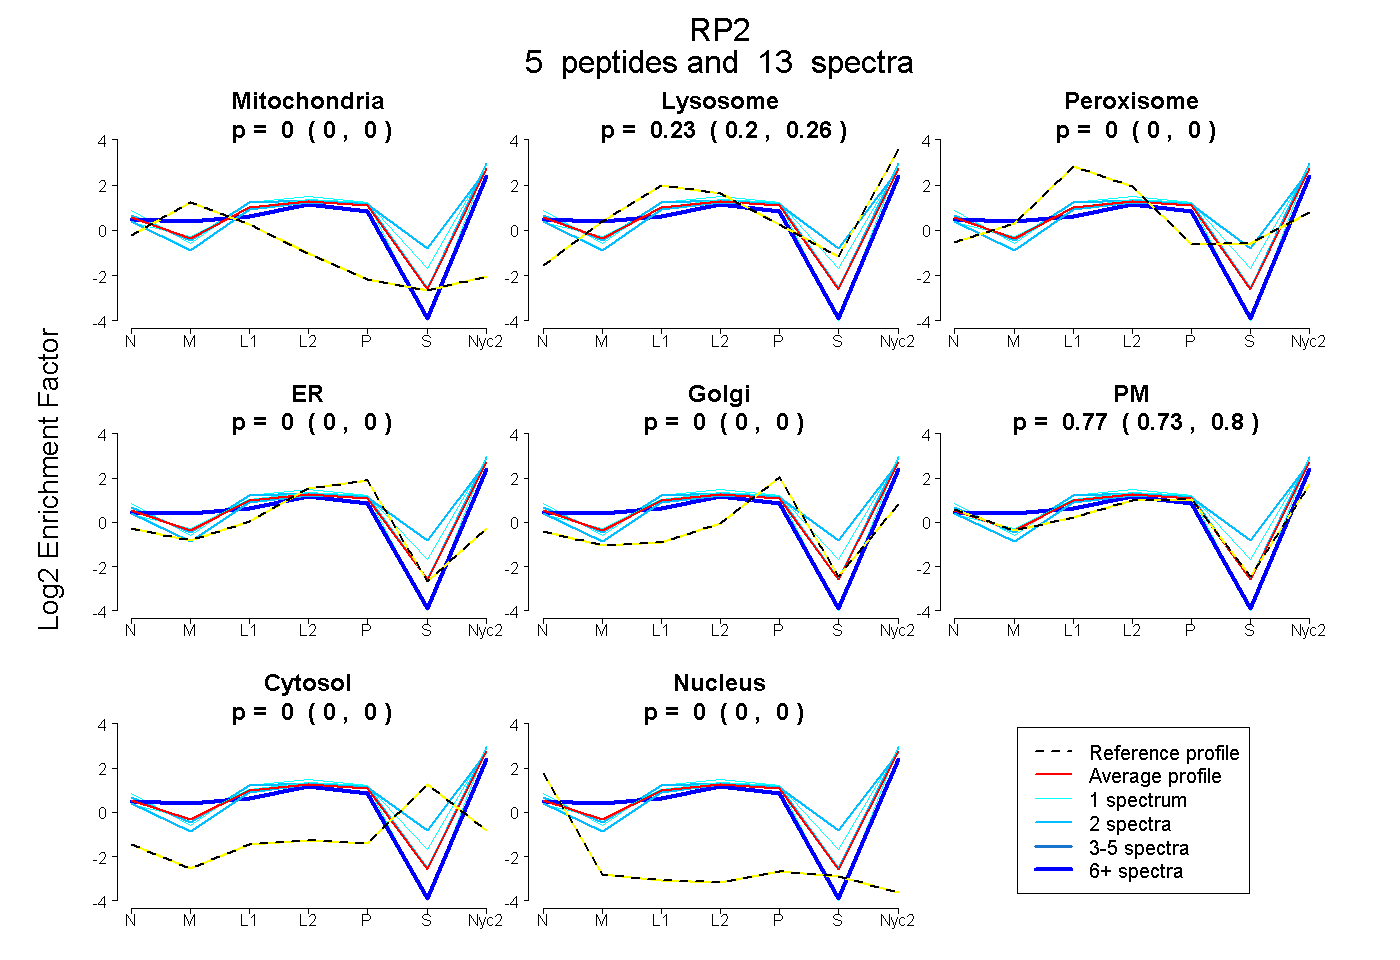
0.000 | 0.000
0.196 | 0.260
0.000 | 0.000
0.000 | 0.000
0.000 | 0.000
0.734 | 0.797
0.000 | 0.000
0.000 | 0.000
4peptides
spectra
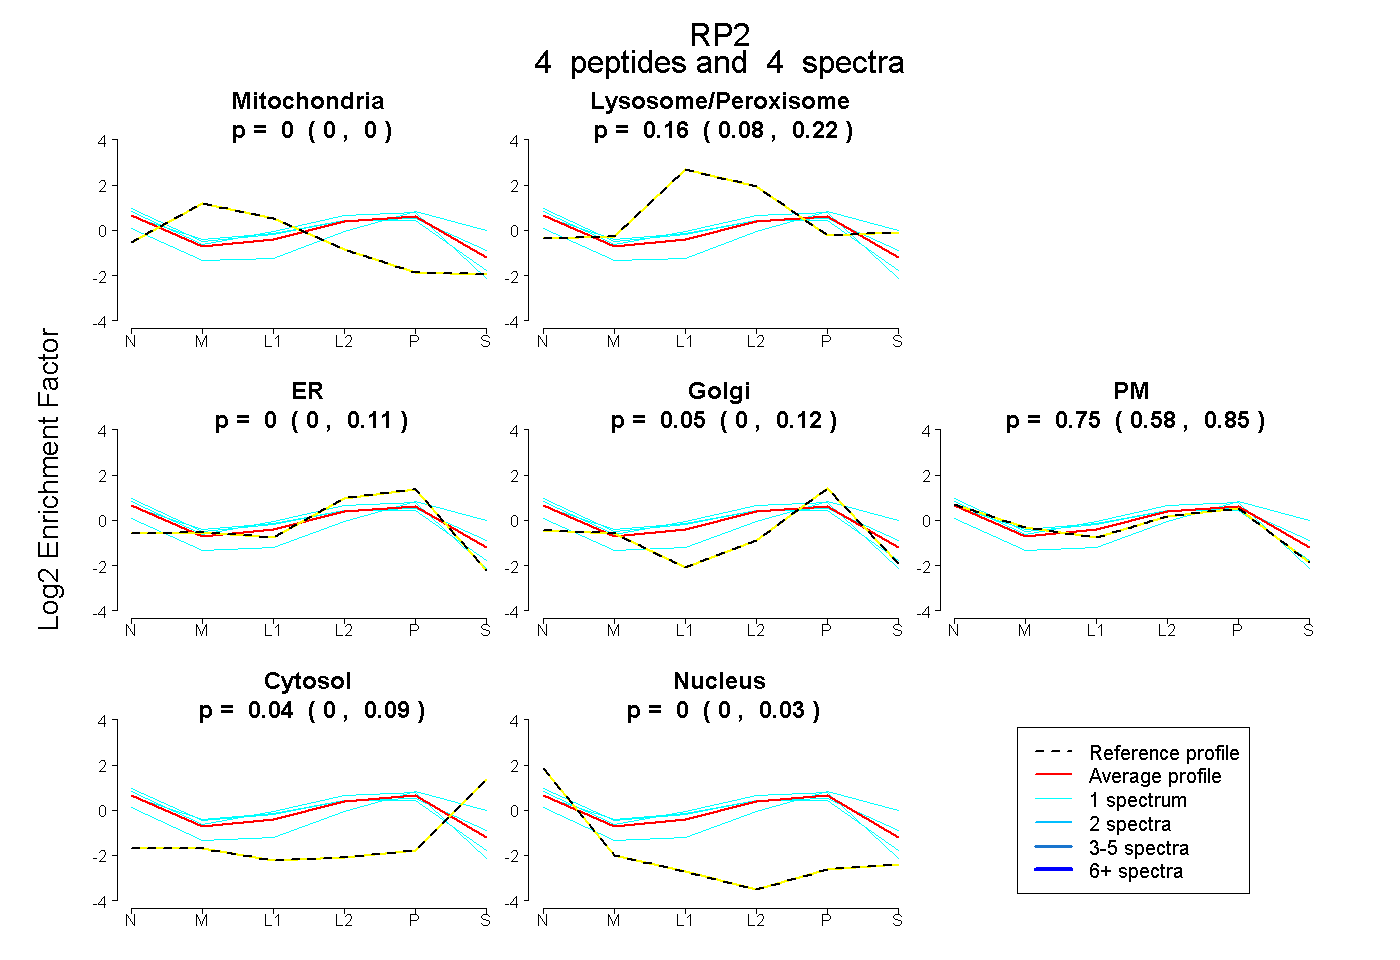
0.000 | 0.000
0.076 | 0.218
0.000 | 0.109
0.000 | 0.123
0.585 | 0.847
0.000 | 0.087
0.000 | 0.030
7peptides
spectra
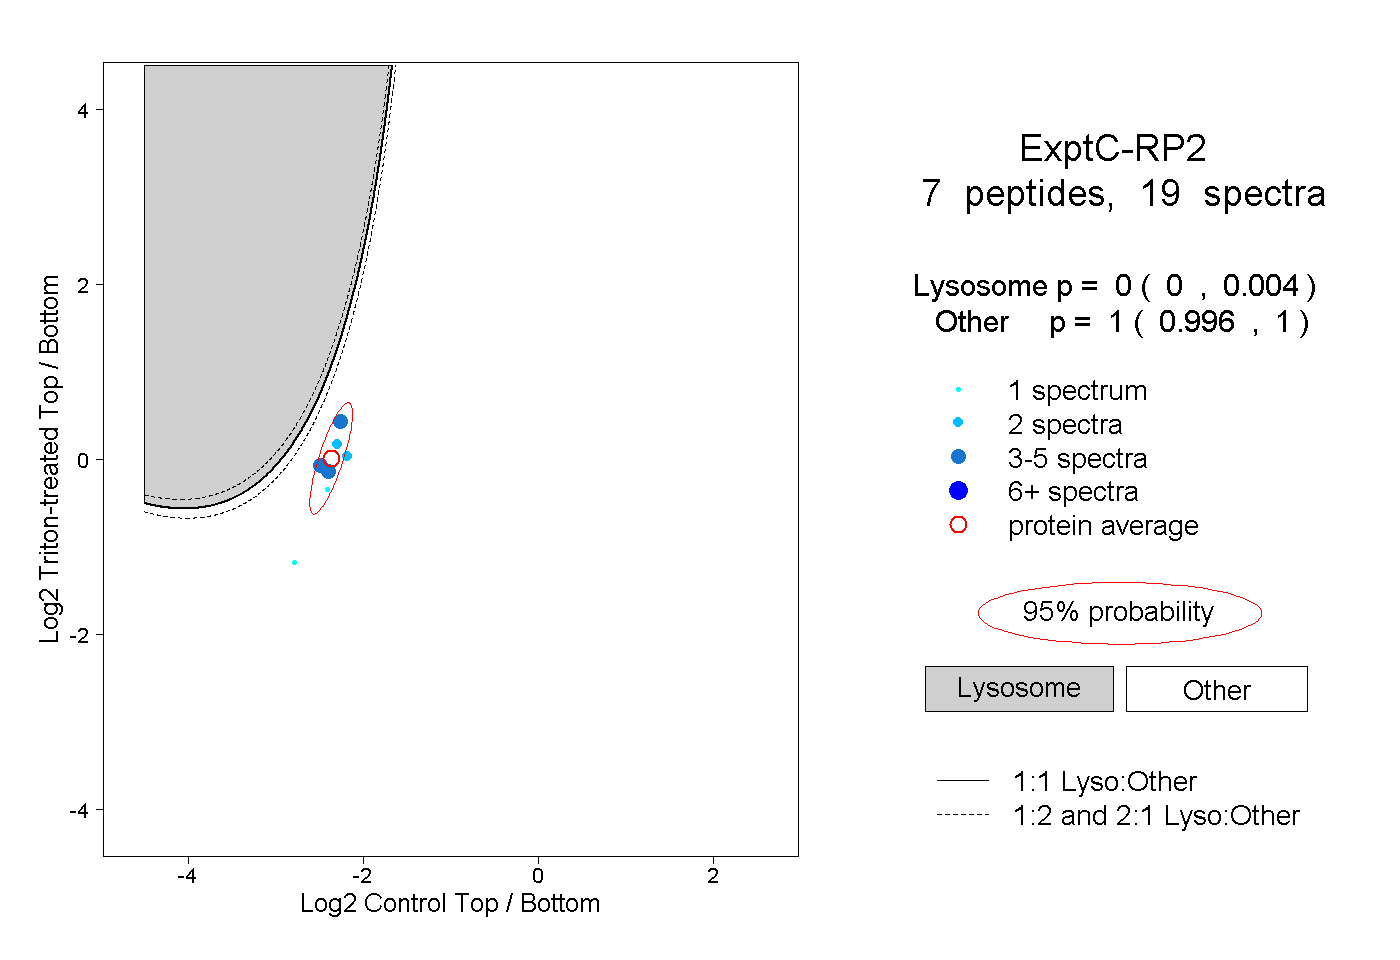
0.000 | 0.004
0.996 | 1.000
3peptides
spectra
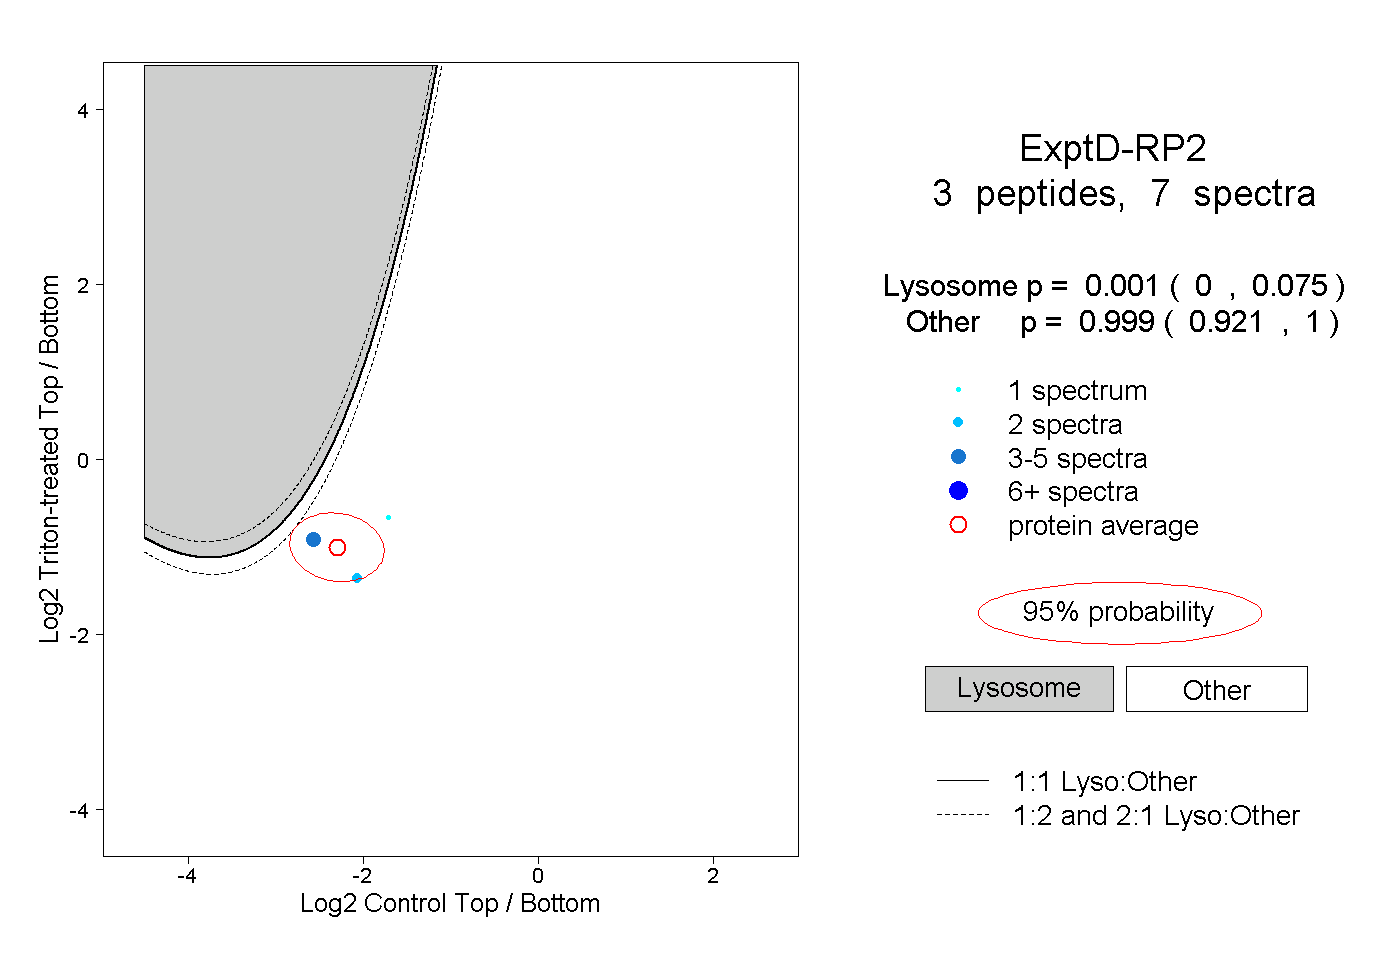
0.000 | 0.075
0.921 | 1.000