 5
5peptides
spectra
0.000 | 0.000
0.196 | 0.260
0.000 | 0.000
0.000 | 0.000
0.000 | 0.000
0.734 | 0.797
0.000 | 0.000
0.000 | 0.000
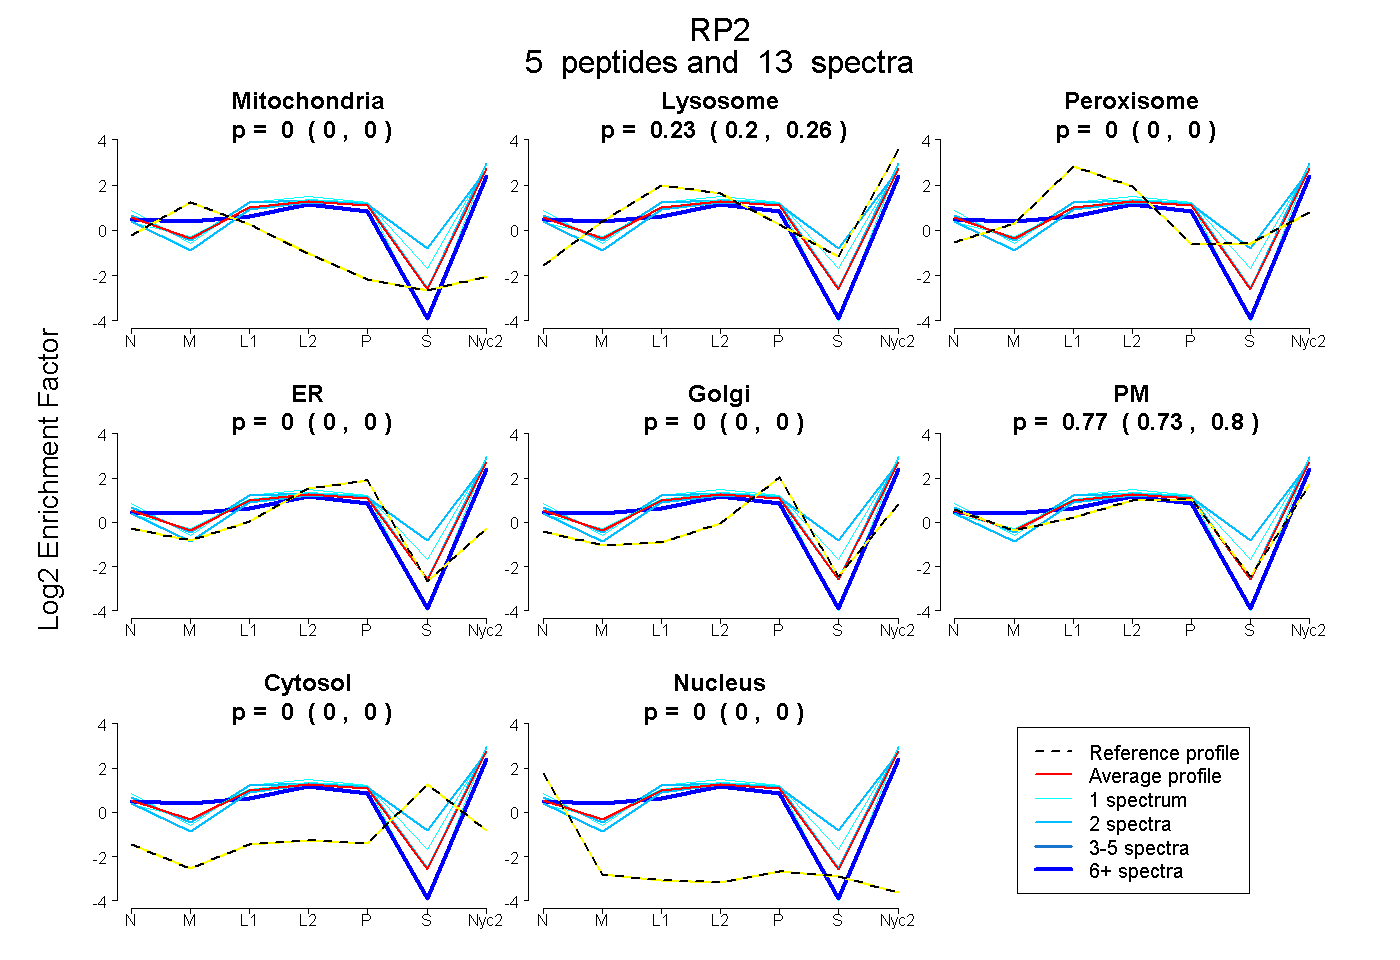
| Plot | Mito | Lyso | Perox | ER | Golgi | PM | Cytosol | Nucleus | |||||
| Expt A |
5 peptides |
13 spectra |
|
0.000 0.000 | 0.000 |
0.233 0.196 | 0.260 |
0.000 0.000 | 0.000 |
0.000 0.000 | 0.000 |
0.000 0.000 | 0.000 |
0.767 0.734 | 0.797 |
0.000 0.000 | 0.000 |
0.000 0.000 | 0.000 |
| 2 spectra, GSVFFR | 0.000 | 0.265 | 0.000 | 0.000 | 0.000 | 0.735 | 0.000 | 0.000 | ||
| 2 spectra, SIVPVSR | 0.000 | 0.366 | 0.000 | 0.000 | 0.000 | 0.565 | 0.069 | 0.000 | ||
| 1 spectrum, LIDEMVGK | 0.000 | 0.368 | 0.000 | 0.000 | 0.000 | 0.632 | 0.000 | 0.000 | ||
| 7 spectra, ISTDPNR | 0.000 | 0.079 | 0.000 | 0.000 | 0.000 | 0.921 | 0.000 | 0.000 | ||
| 1 spectrum, GFSLVQTK | 0.000 | 0.106 | 0.000 | 0.000 | 0.000 | 0.894 | 0.000 | 0.000 |
| Plot | Mito | Lyso or Perox | ER | Golgi | PM | Cytosol | Nucleus | ||||||
| Expt B |
4 peptides |
4 spectra |
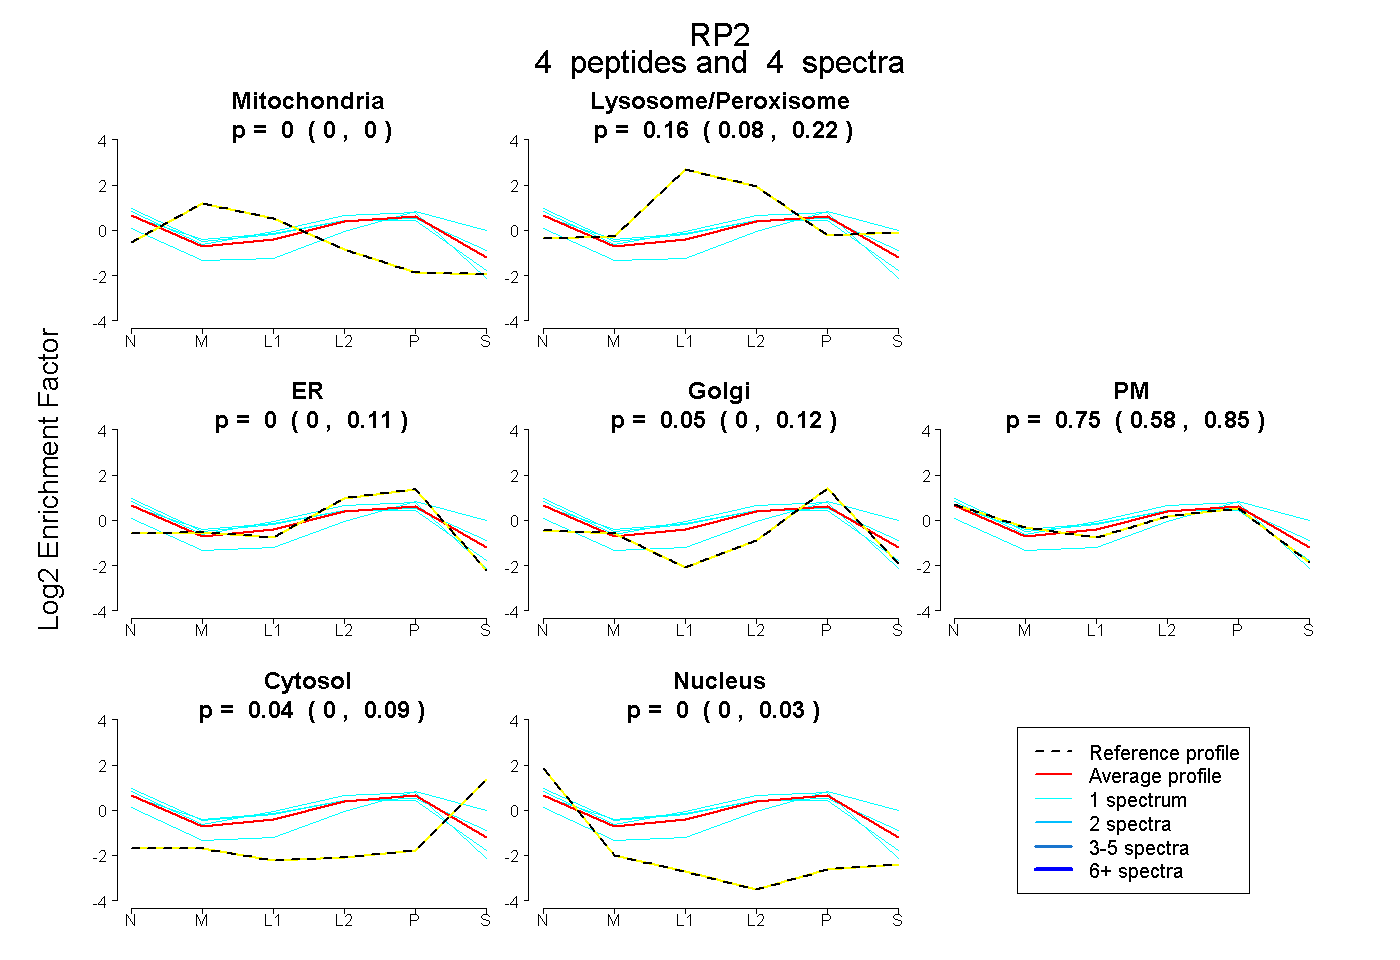 |
0.000 0.000 | 0.000 |
0.157 0.076 | 0.218 |
0.000 0.000 | 0.109 |
0.050 0.000 | 0.123 |
0.754 0.585 | 0.847 |
0.039 0.000 | 0.087 |
0.000 0.000 | 0.030 |
|||
| Plot | Lyso | Other | |||||||||||
| Expt C |
7 peptides |
19 spectra |
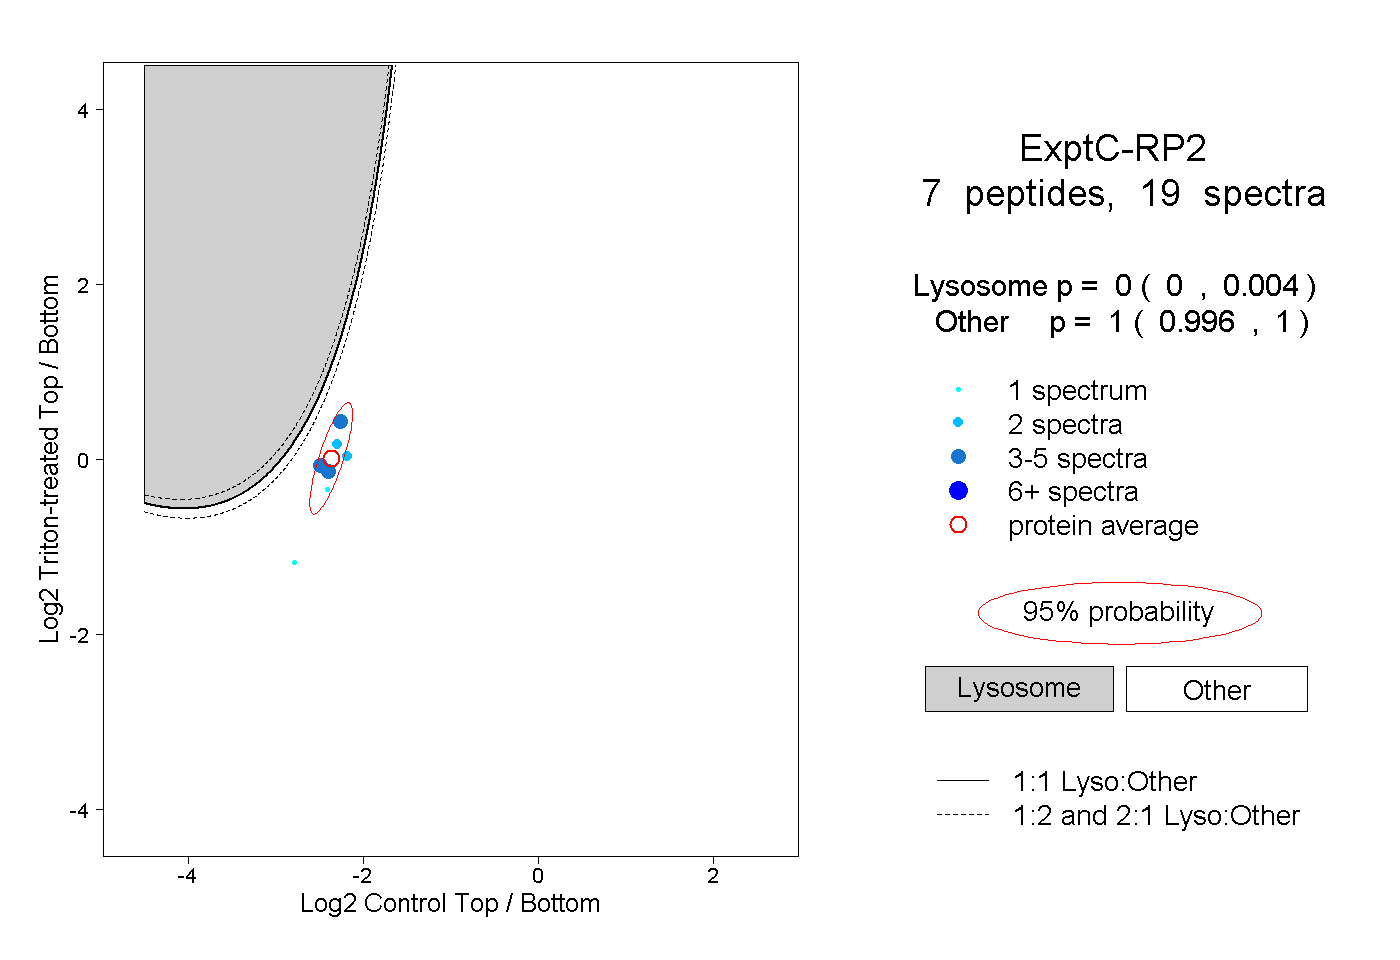 |
0.000 0.000 | 0.004 |
1.000 0.996 | 1.000 |
||||||||
| Plot | Lyso | Other | |||||||||||
| Expt D |
3 peptides |
7 spectra |
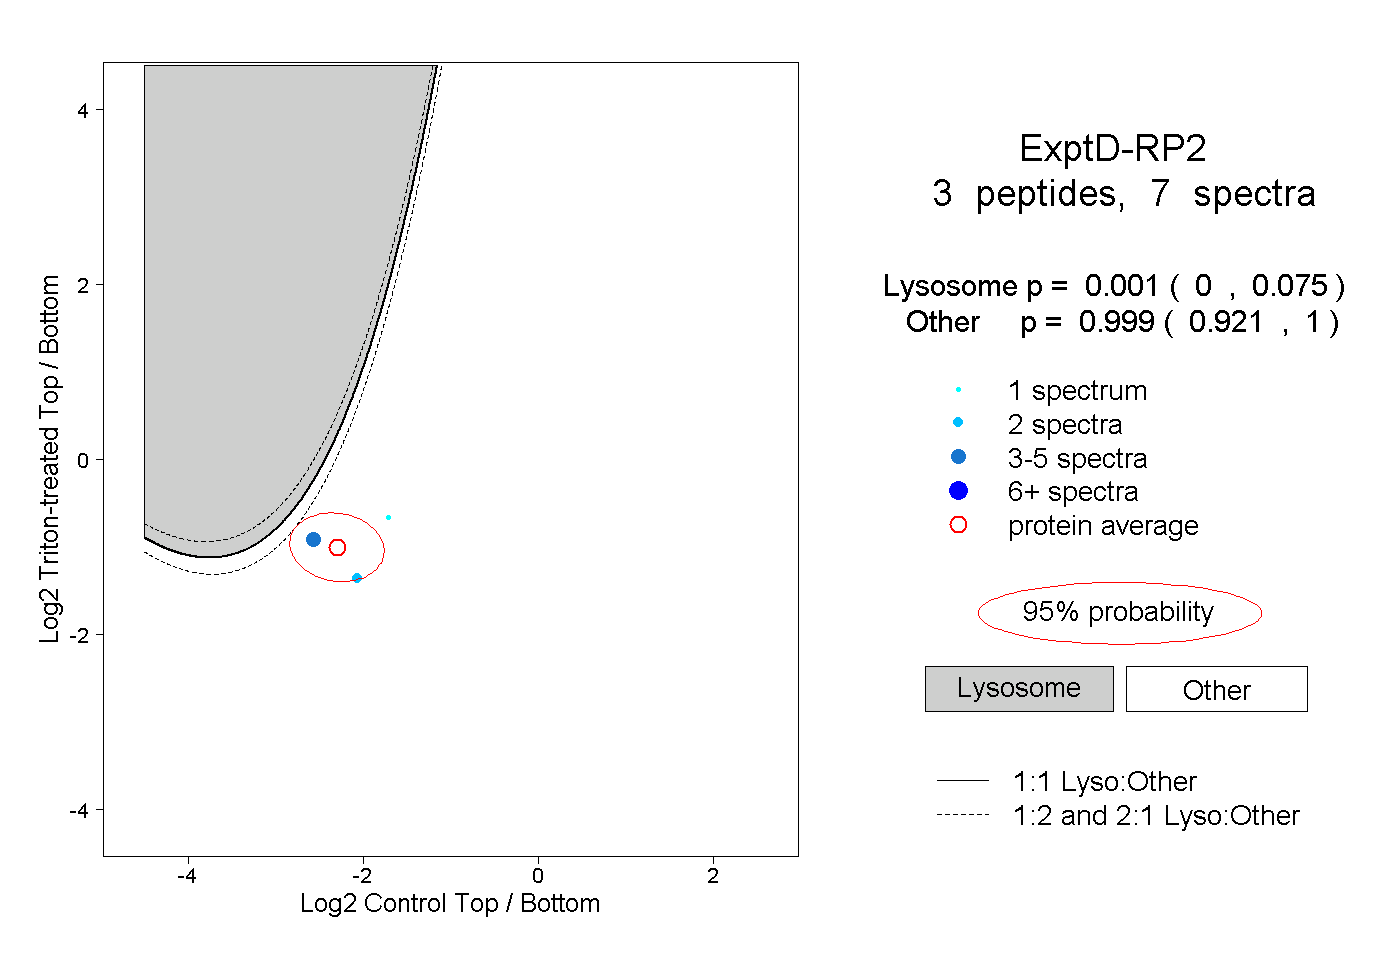 |
0.001 0.000 | 0.075 |
0.999 0.921 | 1.000 |