 12
12peptides
spectra
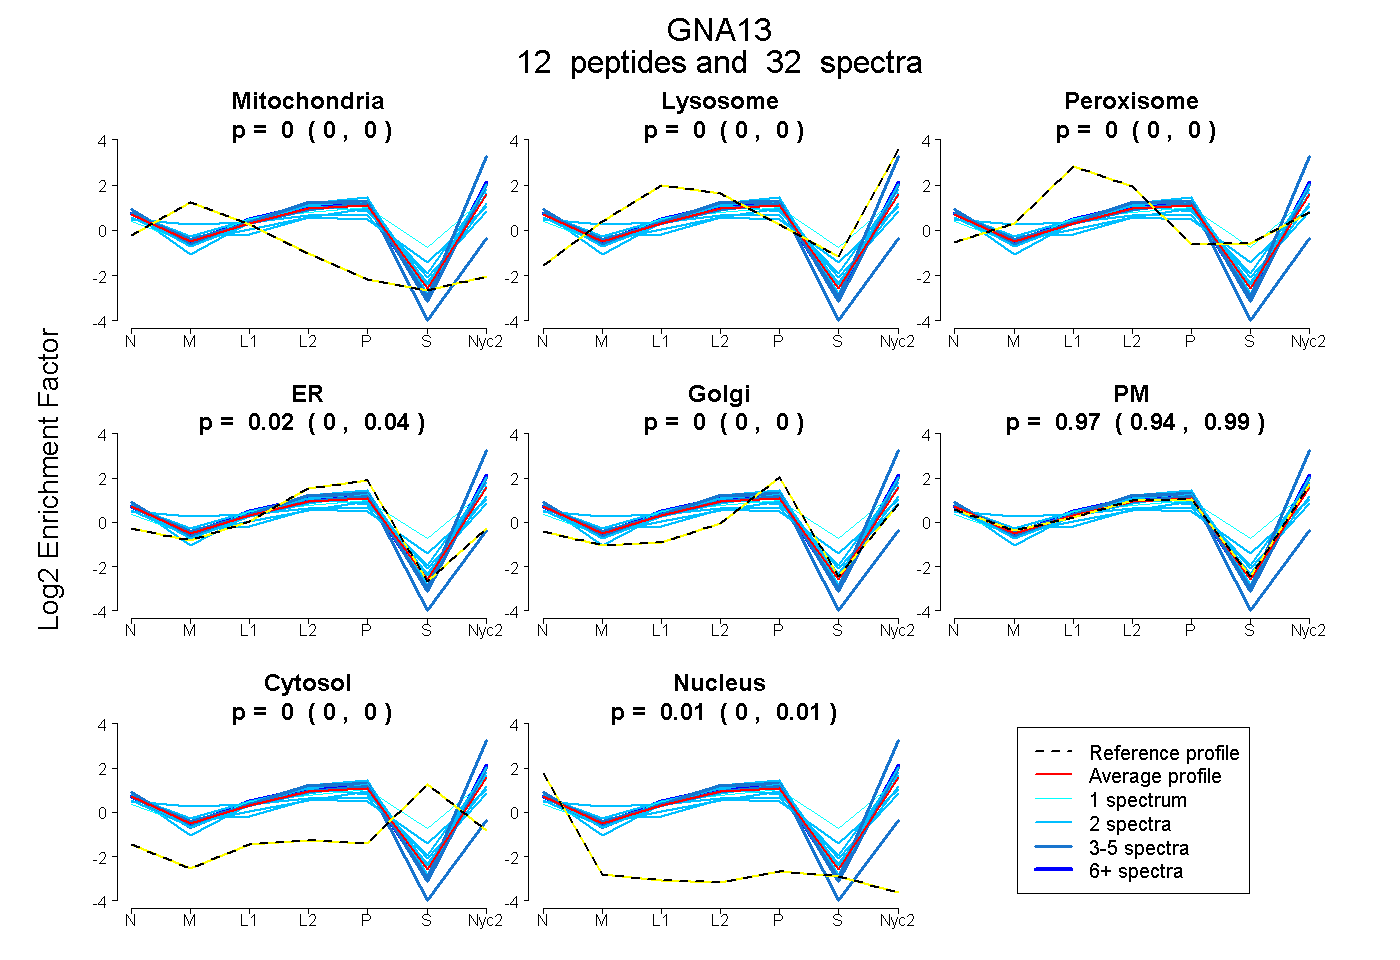
0.000 | 0.000
0.000 | 0.000
0.000 | 0.003
0.000 | 0.044
0.000 | 0.000
0.938 | 0.994
0.000 | 0.000
0.003 | 0.012
3peptides
spectra
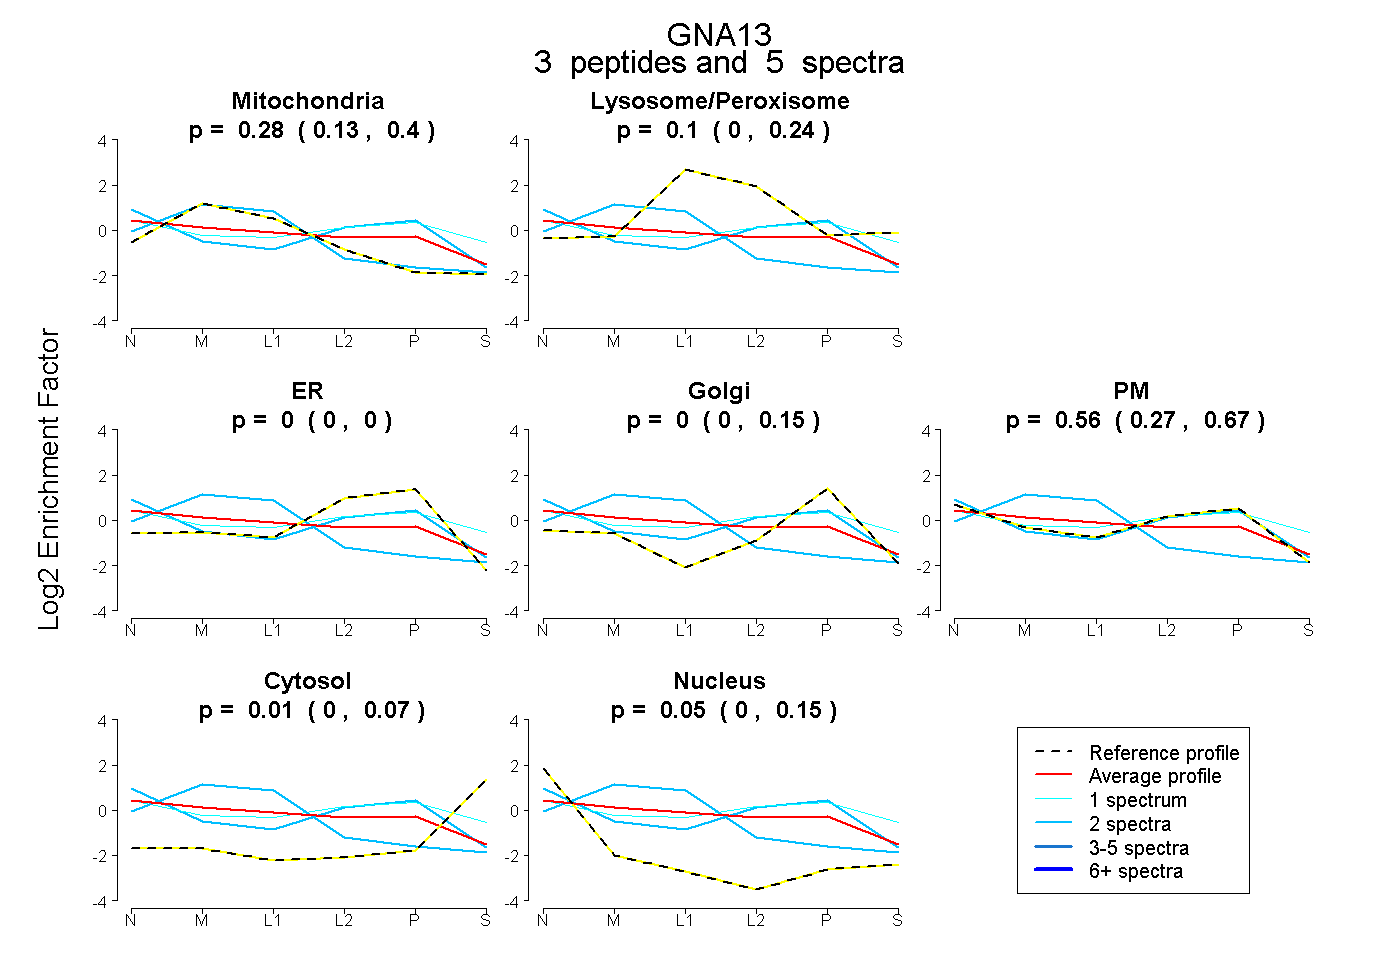
0.130 | 0.399
0.000 | 0.240
0.000 | 0.000
0.000 | 0.146
0.273 | 0.669
0.000 | 0.067
0.000 | 0.154
15peptides
spectra
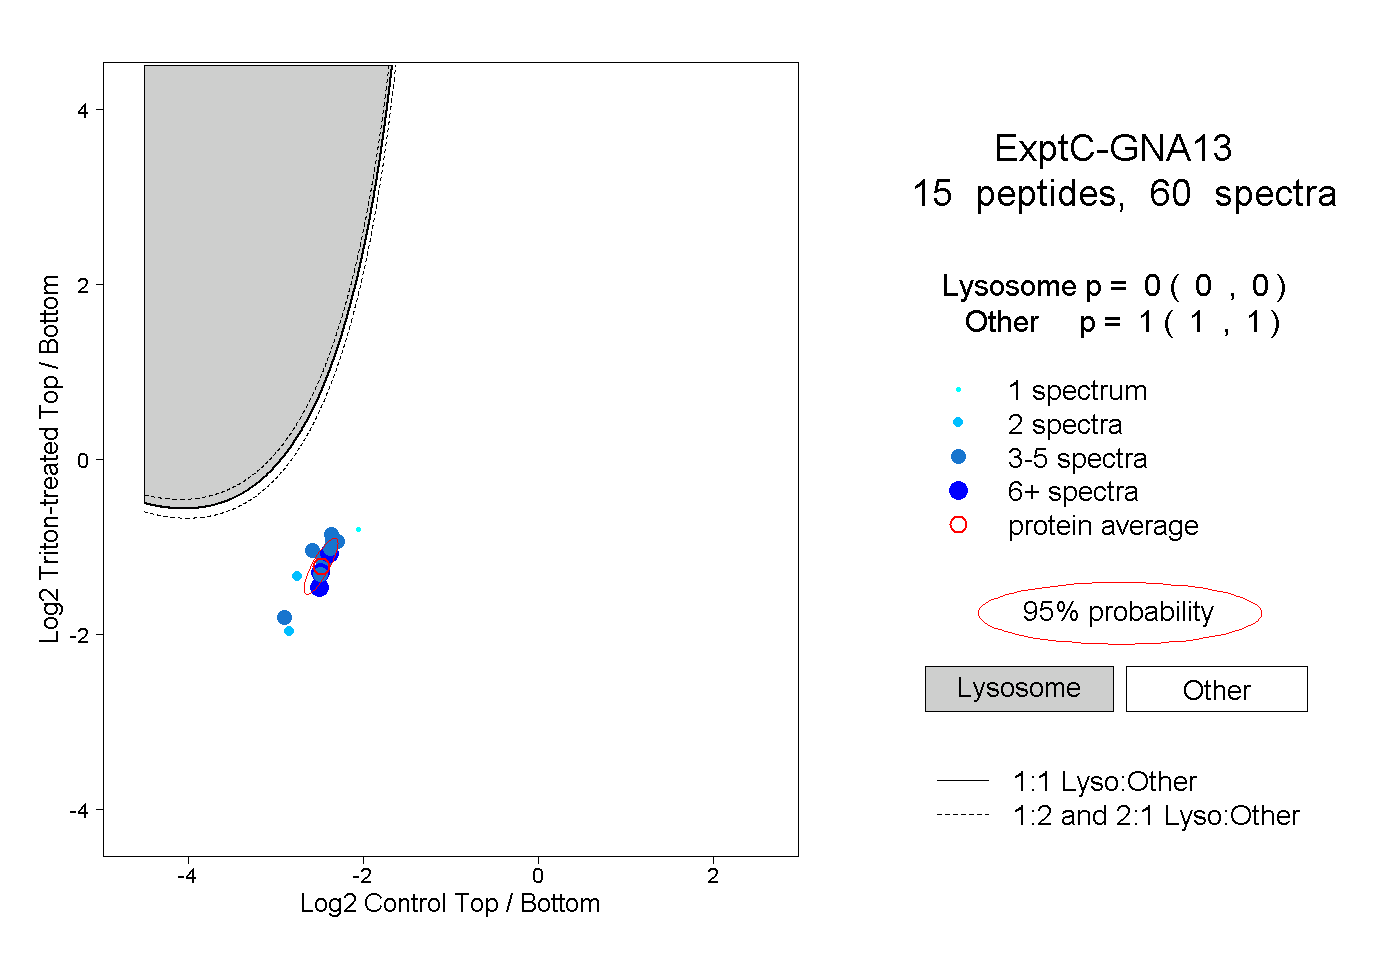
0.000 | 0.000
1.000 | 1.000
3peptides
spectra
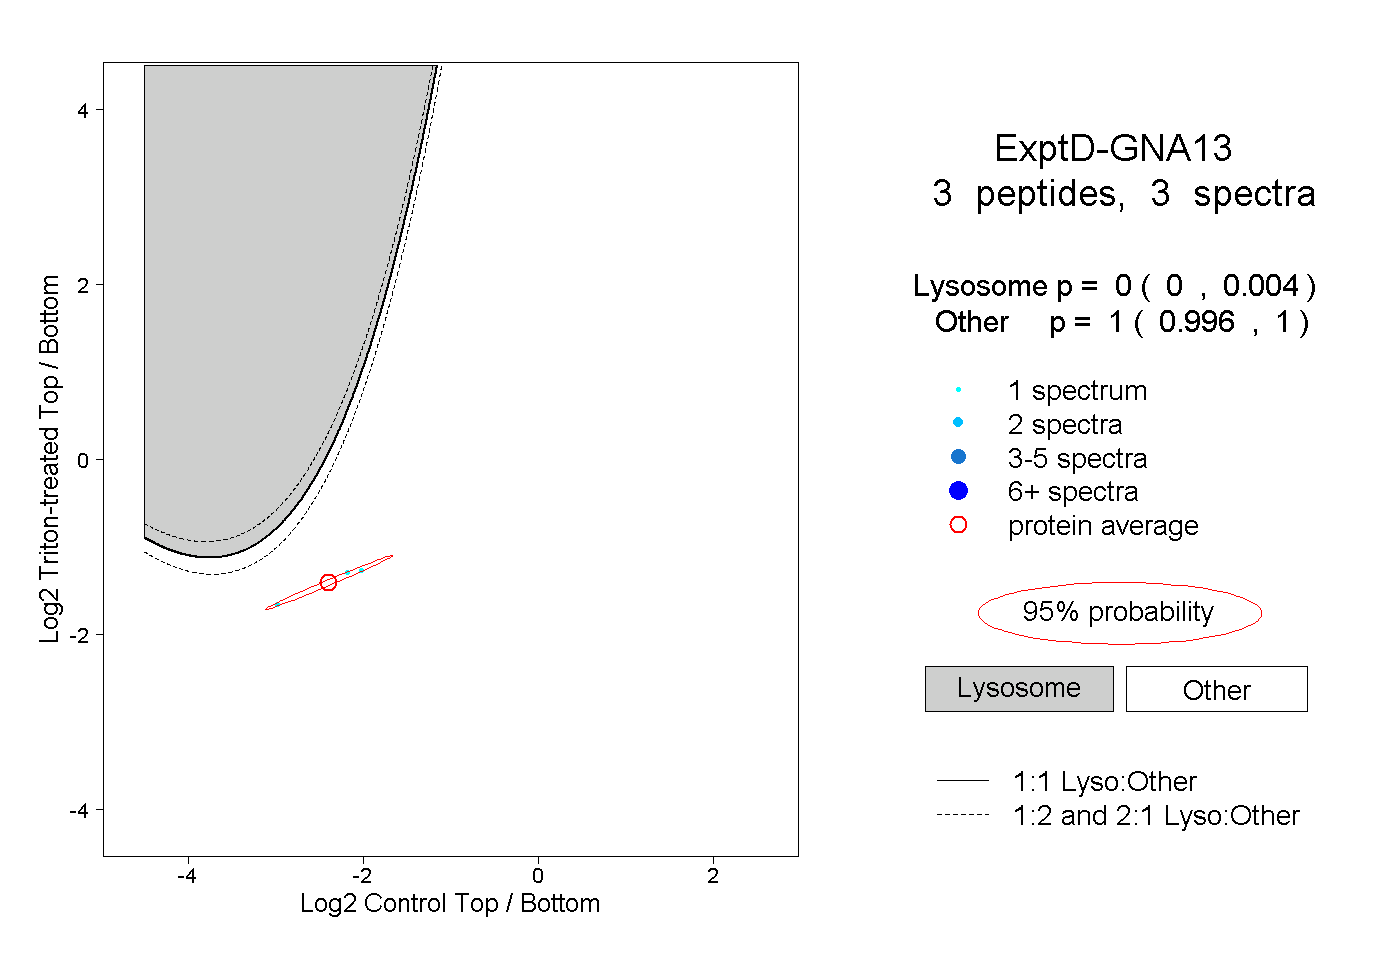
0.000 | 0.004
0.996 | 1.000