 12
12peptides
spectra
0.000 | 0.000
0.000 | 0.000
0.000 | 0.003
0.000 | 0.044
0.000 | 0.000
0.938 | 0.994
0.000 | 0.000
0.003 | 0.012
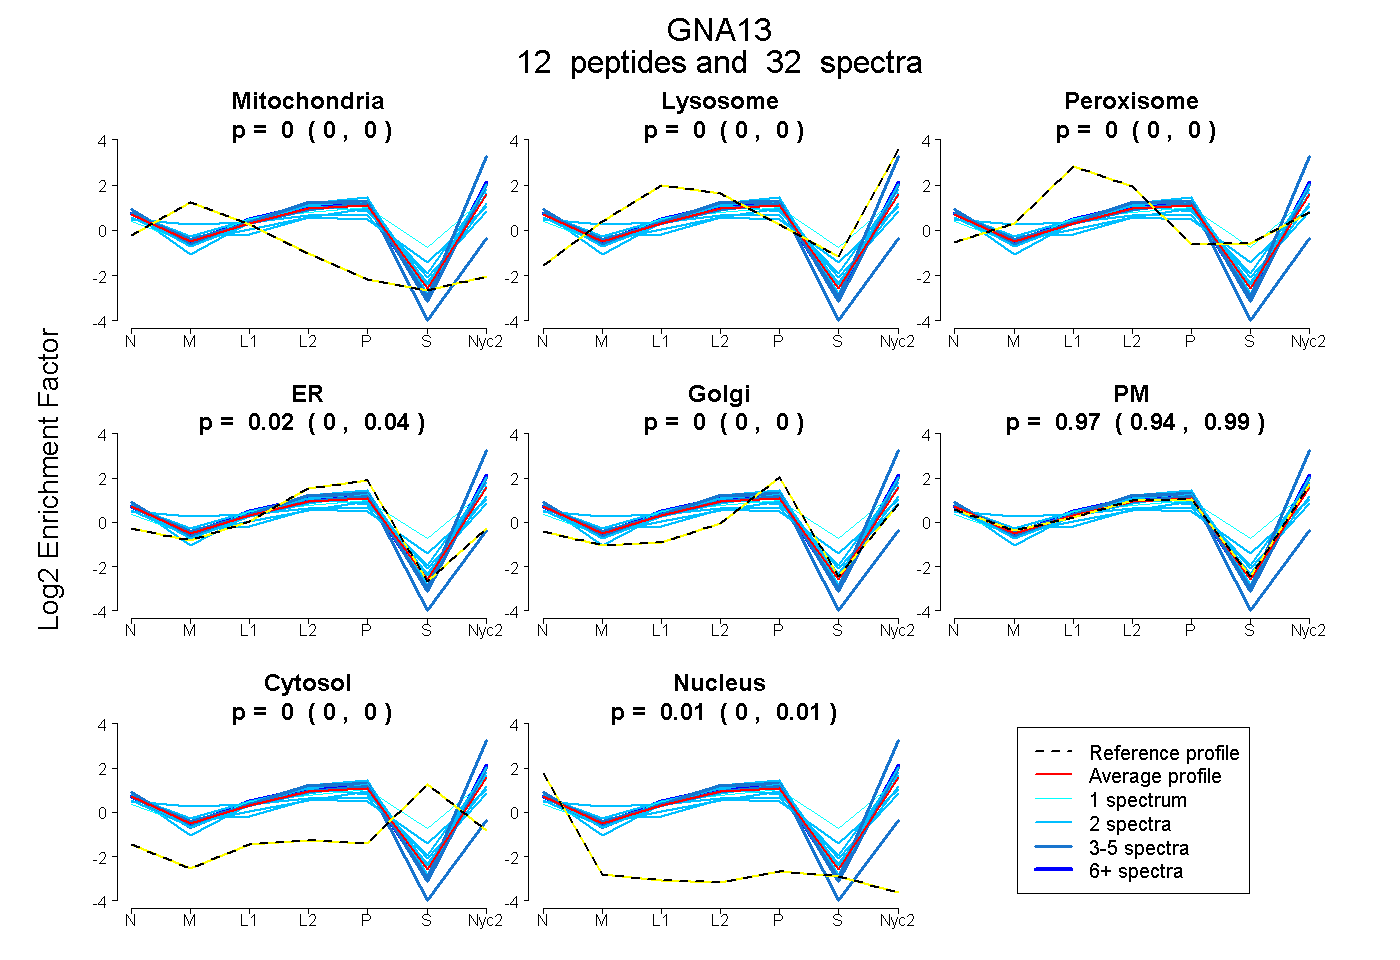
| Plot | Mito | Lyso | Perox | ER | Golgi | PM | Cytosol | Nucleus | |||||
| Expt A |
12 peptides |
32 spectra |
|
0.000 0.000 | 0.000 |
0.000 0.000 | 0.000 |
0.000 0.000 | 0.003 |
0.023 0.000 | 0.044 |
0.000 0.000 | 0.000 |
0.969 0.938 | 0.994 |
0.000 0.000 | 0.000 |
0.008 0.003 | 0.012 |
| 4 spectra, FLVECFR | 0.048 | 0.000 | 0.000 | 0.670 | 0.000 | 0.215 | 0.000 | 0.067 | ||
| 3 spectra, YFLDNLDK | 0.000 | 0.134 | 0.000 | 0.000 | 0.000 | 0.866 | 0.000 | 0.000 | ||
| 2 spectra, NQVHGDK | 0.045 | 0.000 | 0.029 | 0.000 | 0.000 | 0.767 | 0.149 | 0.010 | ||
| 2 spectra, LMAFDTR | 0.000 | 0.000 | 0.000 | 0.012 | 0.000 | 0.988 | 0.000 | 0.000 | ||
| 2 spectra, DYFLEFEGDPHCLR | 0.000 | 0.000 | 0.068 | 0.062 | 0.065 | 0.714 | 0.003 | 0.089 | ||
| 3 spectra, VFLQYLPAIR | 0.000 | 0.000 | 0.000 | 0.000 | 0.000 | 1.000 | 0.000 | 0.000 | ||
| 2 spectra, VQVVSIK | 0.000 | 0.000 | 0.000 | 0.000 | 0.000 | 1.000 | 0.000 | 0.000 | ||
| 2 spectra, DTILHDNLK | 0.000 | 0.000 | 0.000 | 0.081 | 0.001 | 0.918 | 0.000 | 0.000 | ||
| 1 spectrum, LHIPWGDNK | 0.000 | 0.092 | 0.121 | 0.000 | 0.000 | 0.626 | 0.162 | 0.000 | ||
| 2 spectra, IIHGQDFDQR | 0.000 | 0.018 | 0.113 | 0.000 | 0.000 | 0.864 | 0.005 | 0.000 | ||
| 2 spectra, EFQLGESVK | 0.157 | 0.044 | 0.012 | 0.000 | 0.000 | 0.786 | 0.000 | 0.000 | ||
| 7 spectra, APMAAQGMVETR | 0.000 | 0.010 | 0.000 | 0.000 | 0.000 | 0.990 | 0.000 | 0.000 |
| Plot | Mito | Lyso or Perox | ER | Golgi | PM | Cytosol | Nucleus | ||||||
| Expt B |
3 peptides |
5 spectra |
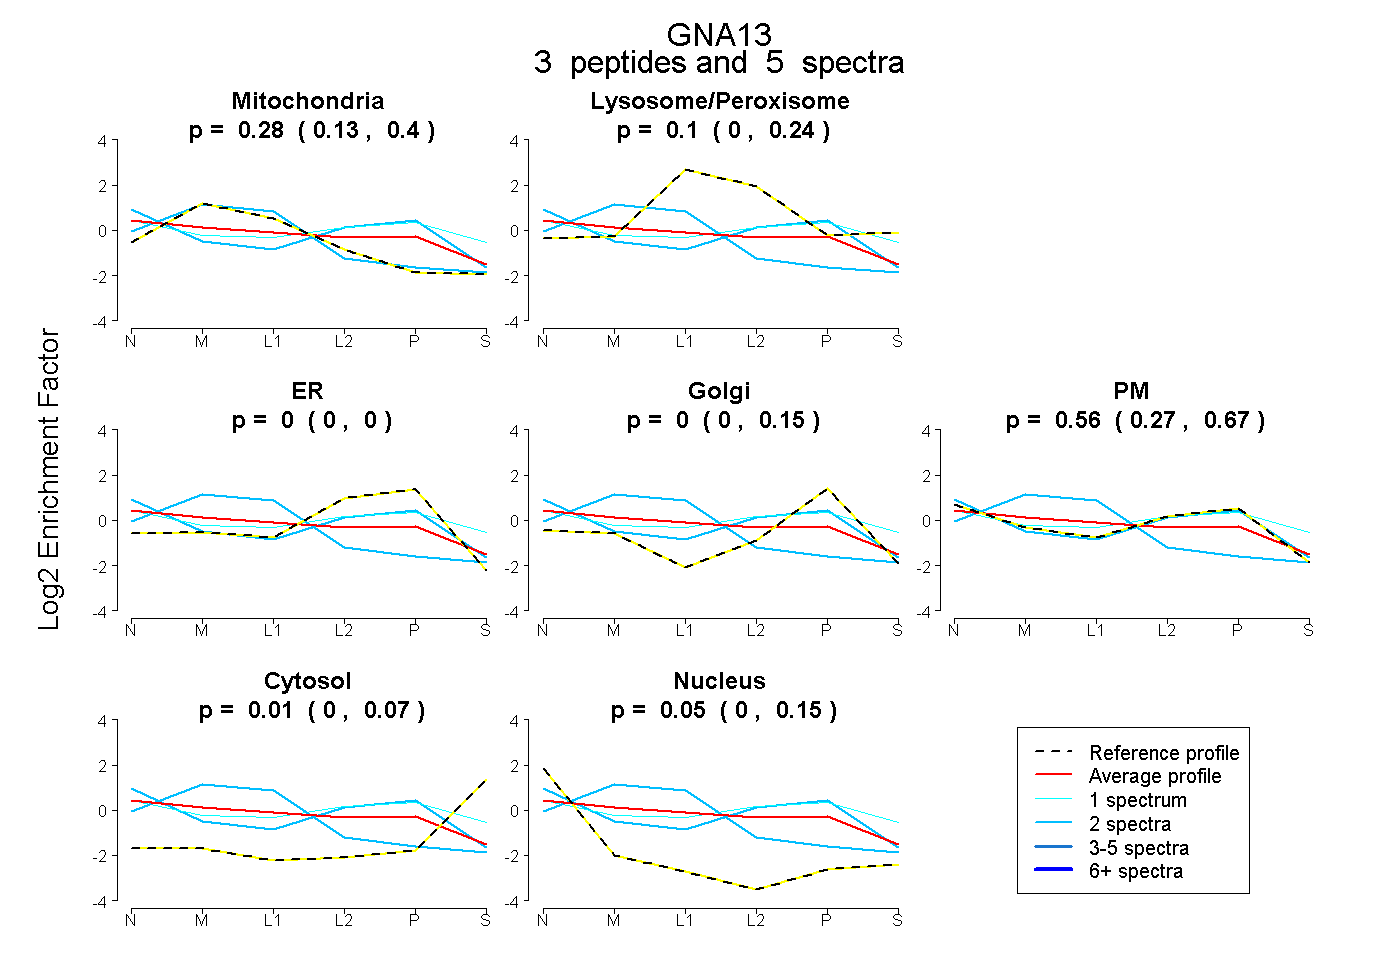 |
0.275 0.130 | 0.399 |
0.105 0.000 | 0.240 |
0.000 0.000 | 0.000 |
0.000 0.000 | 0.146 |
0.555 0.273 | 0.669 |
0.014 0.000 | 0.067 |
0.051 0.000 | 0.154 |
|||
| Plot | Lyso | Other | |||||||||||
| Expt C |
15 peptides |
60 spectra |
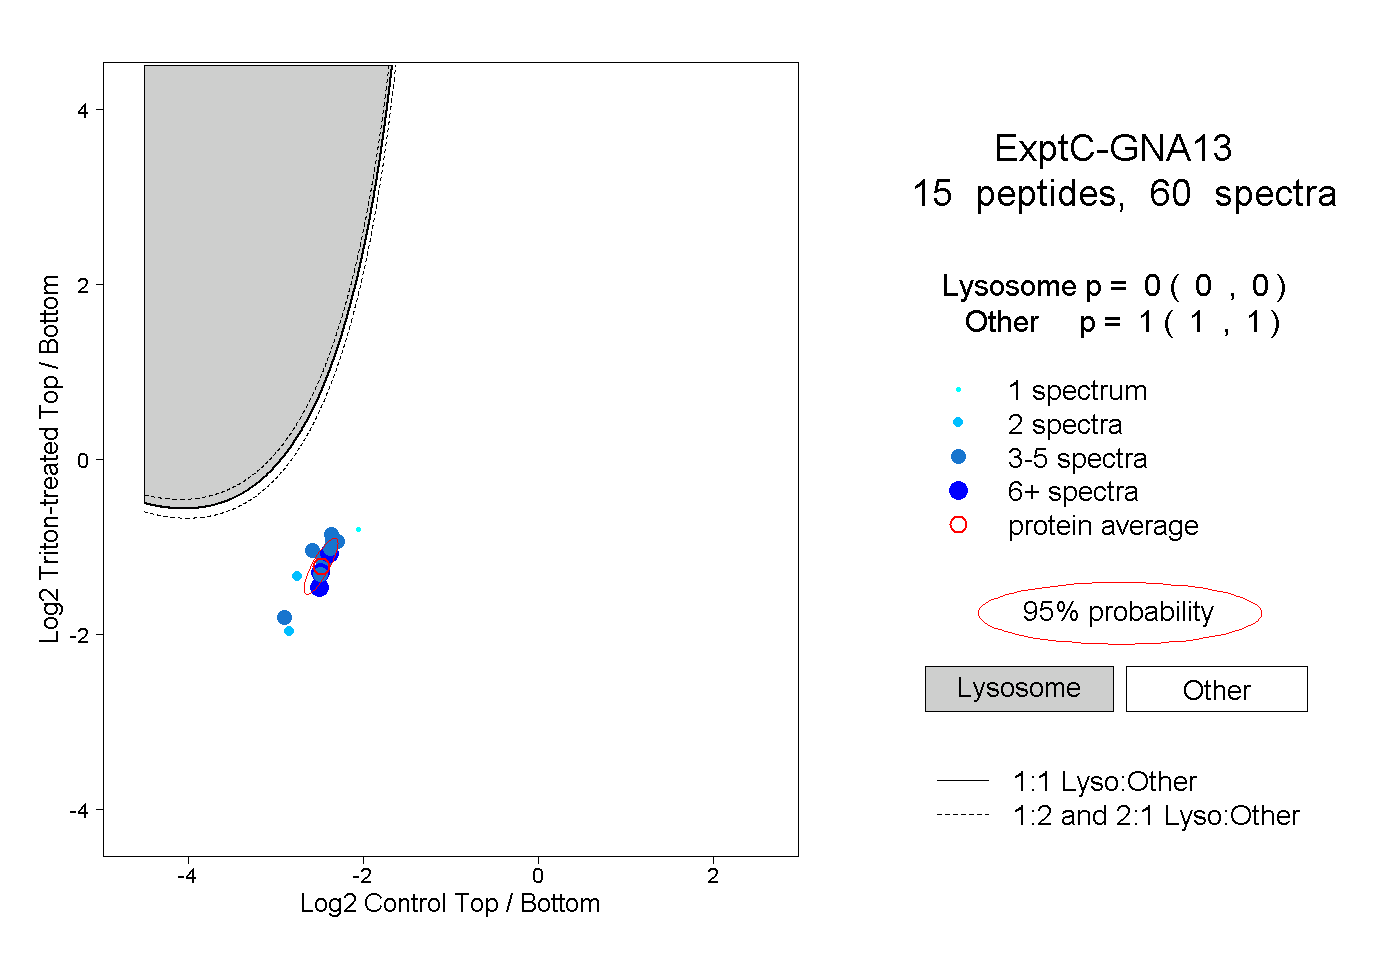 |
0.000 0.000 | 0.000 |
1.000 1.000 | 1.000 |
||||||||
| Plot | Lyso | Other | |||||||||||
| Expt D |
3 peptides |
3 spectra |
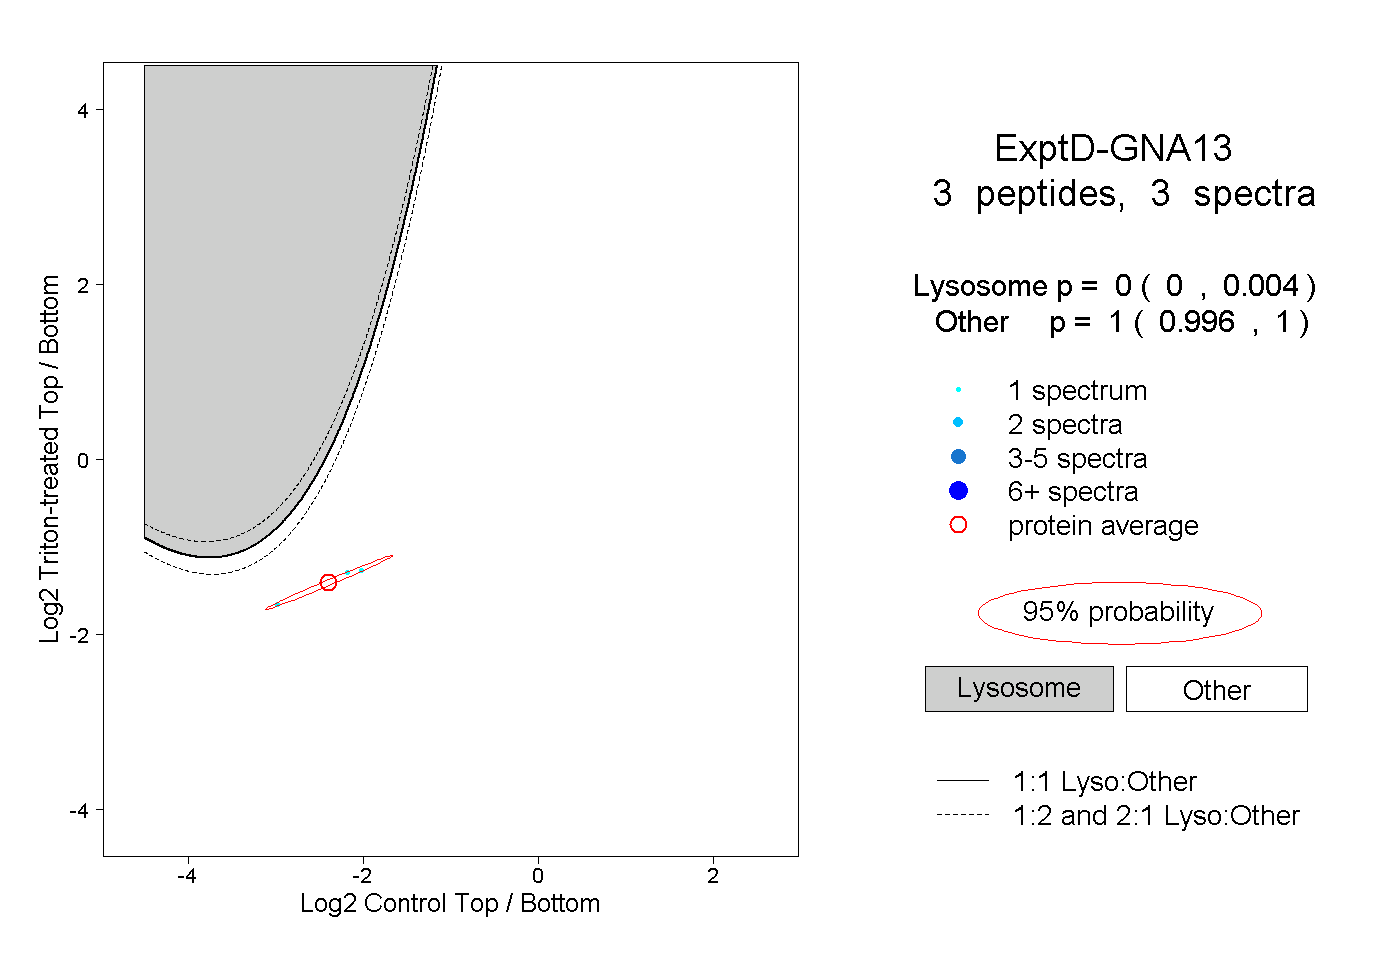 |
0.000 0.000 | 0.004 |
1.000 0.996 | 1.000 |