 15
15peptides
spectra
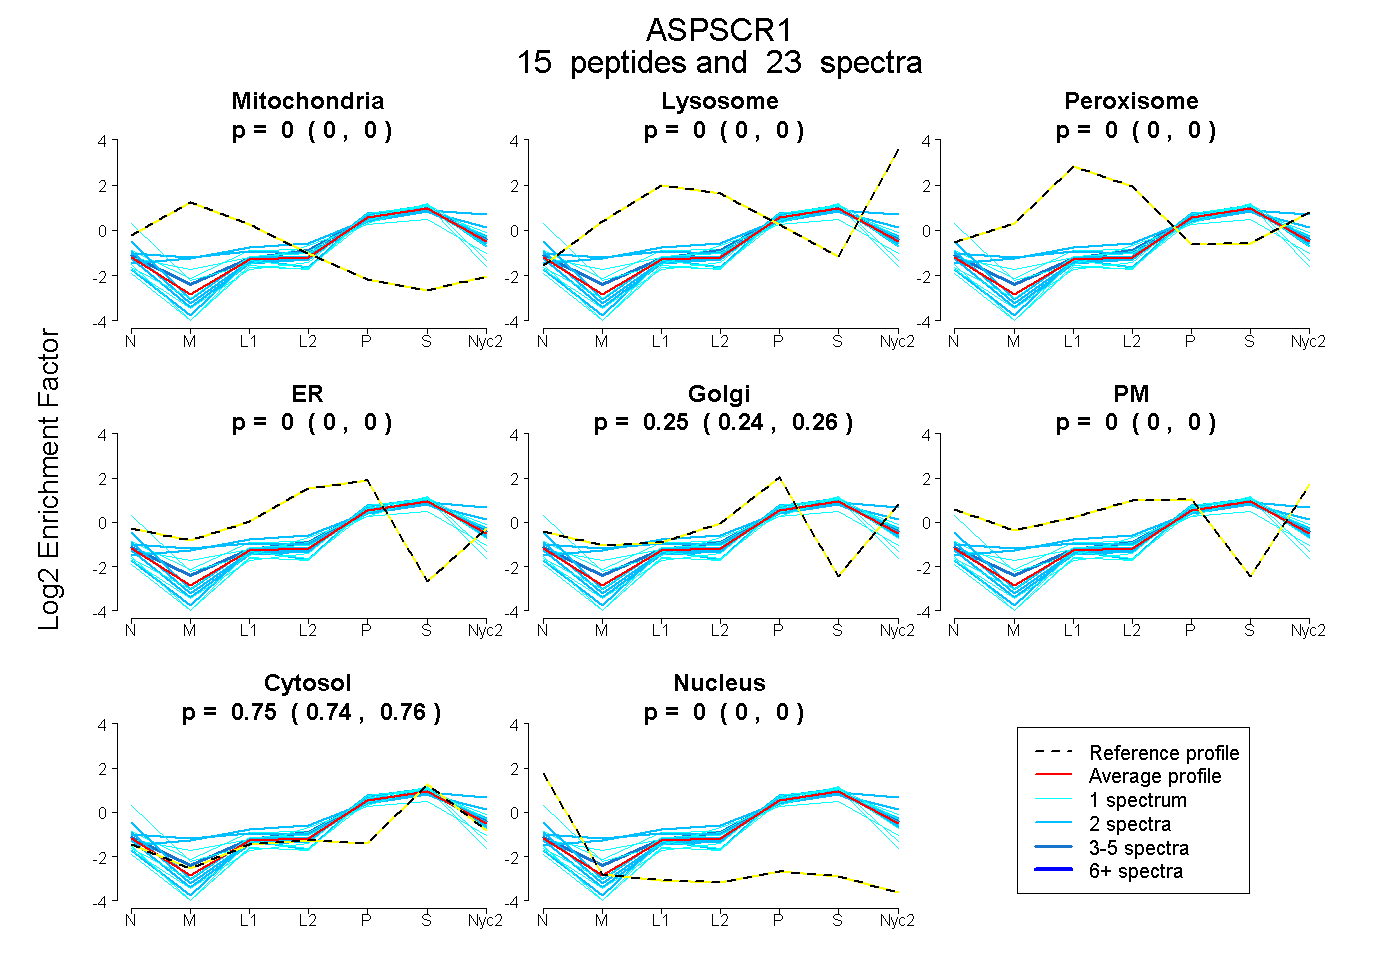
0.000 | 0.000
0.000 | 0.000
0.000 | 0.000
0.000 | 0.000
0.244 | 0.256
0.000 | 0.000
0.743 | 0.755
0.000 | 0.000
5peptides
spectra
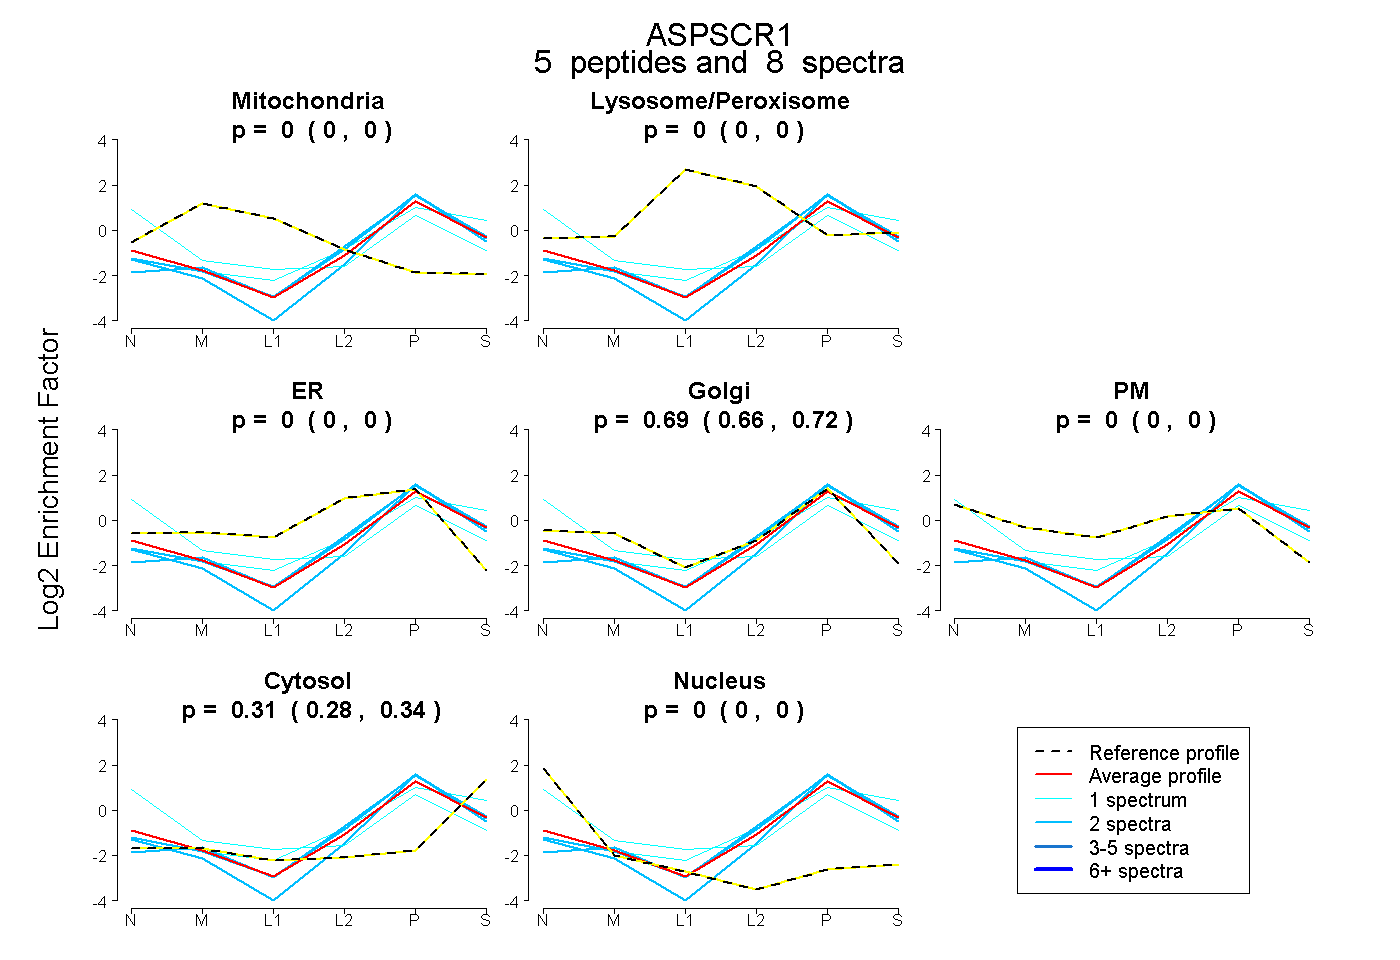
0.000 | 0.000
0.000 | 0.000
0.000 | 0.000
0.657 | 0.715
0.000 | 0.000
0.281 | 0.337
0.000 | 0.000
9peptides
spectra
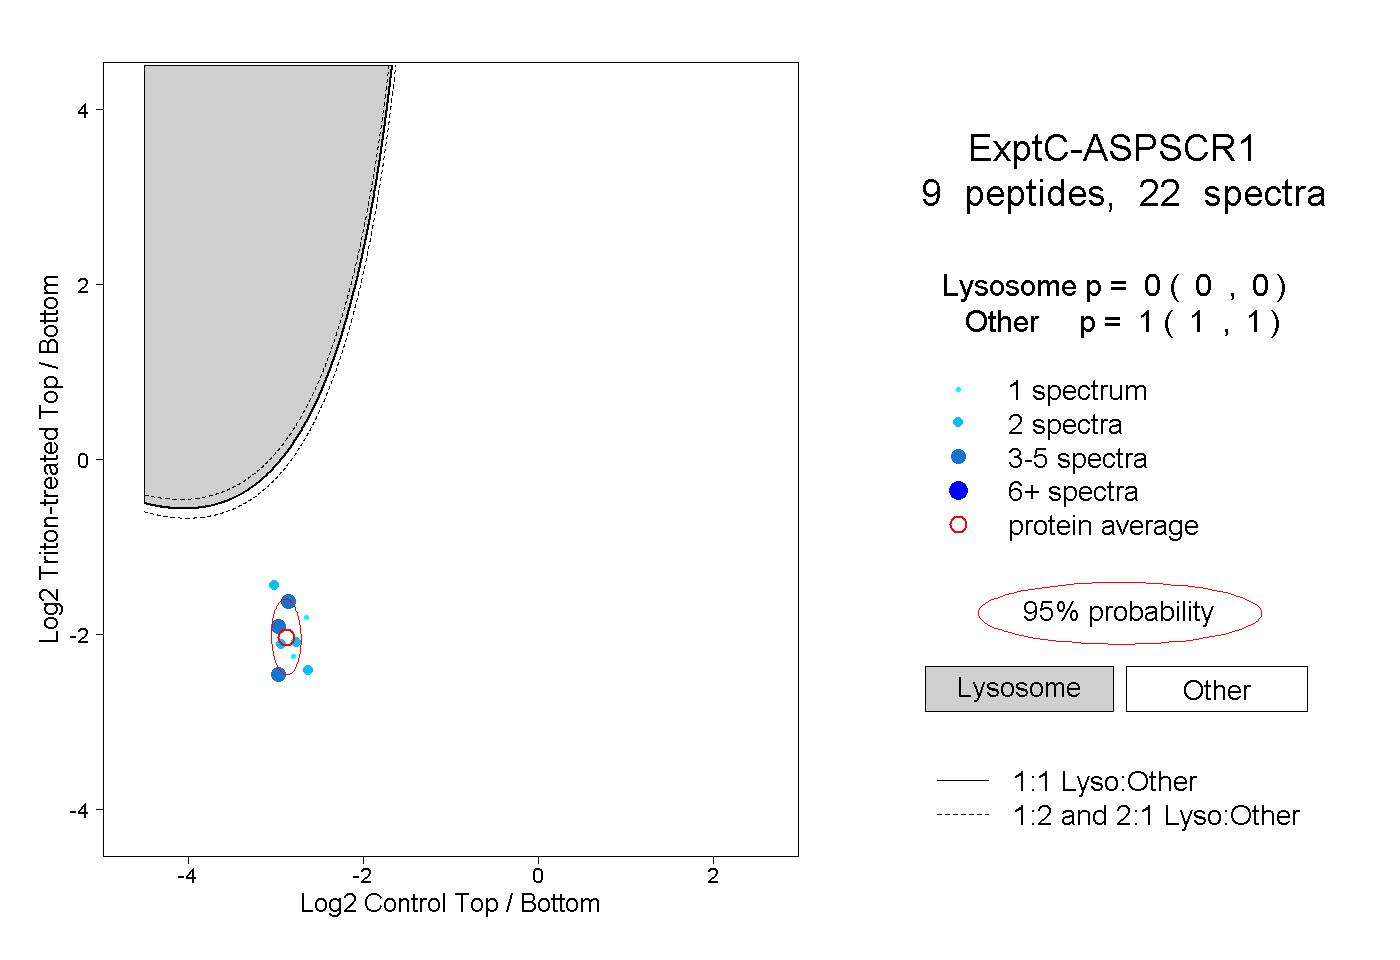
0.000 | 0.000
1.000 | 1.000
3peptides
spectra
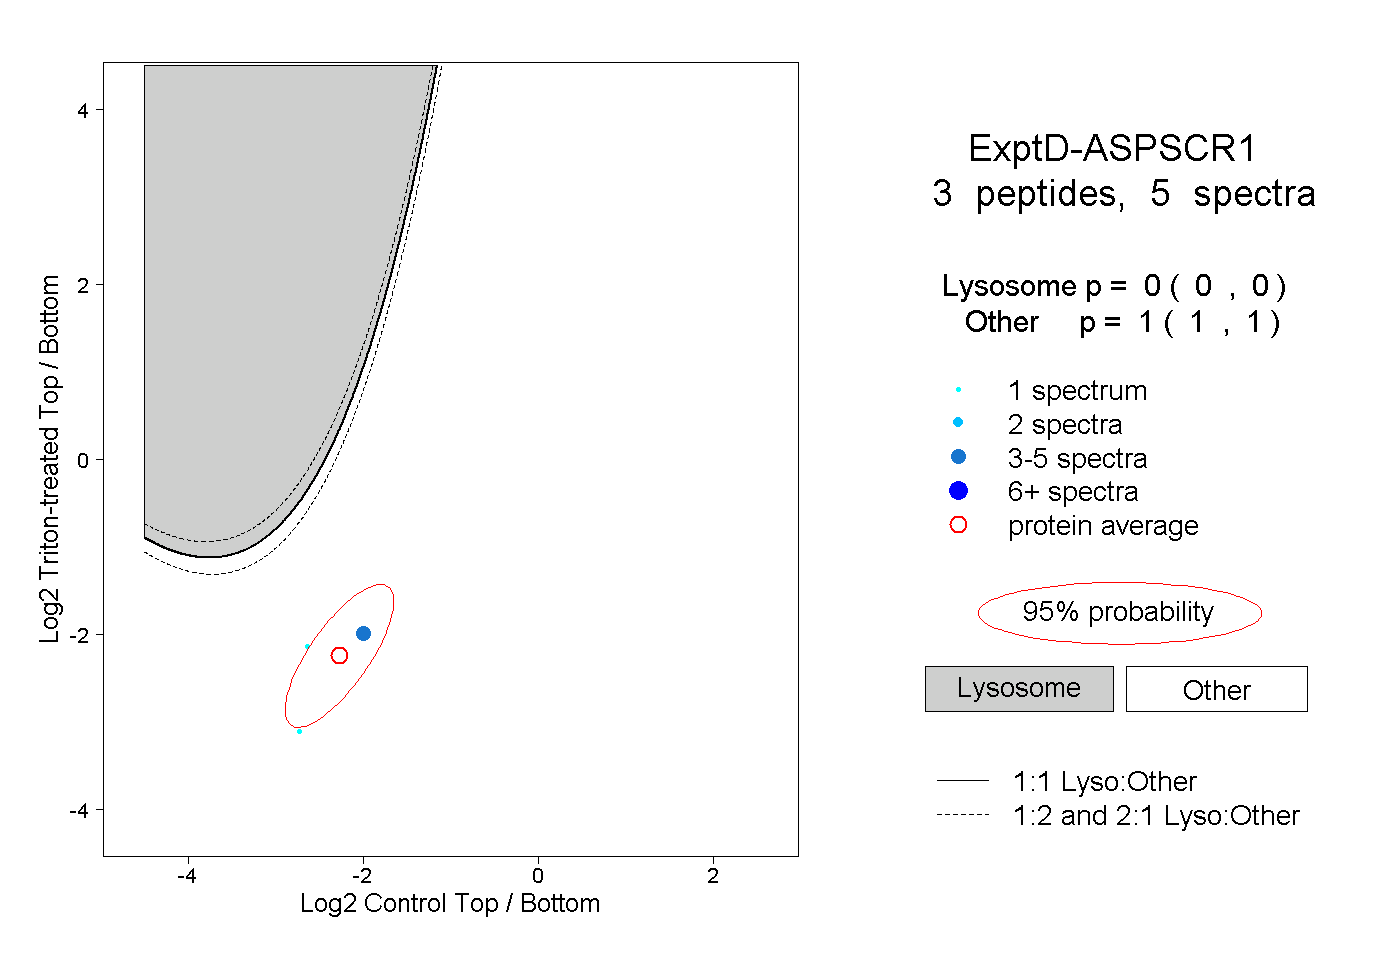
0.000 | 0.000
1.000 | 1.000