 15
15peptides
spectra
0.000 | 0.000
0.000 | 0.000
0.000 | 0.000
0.000 | 0.000
0.244 | 0.256
0.000 | 0.000
0.743 | 0.755
0.000 | 0.000
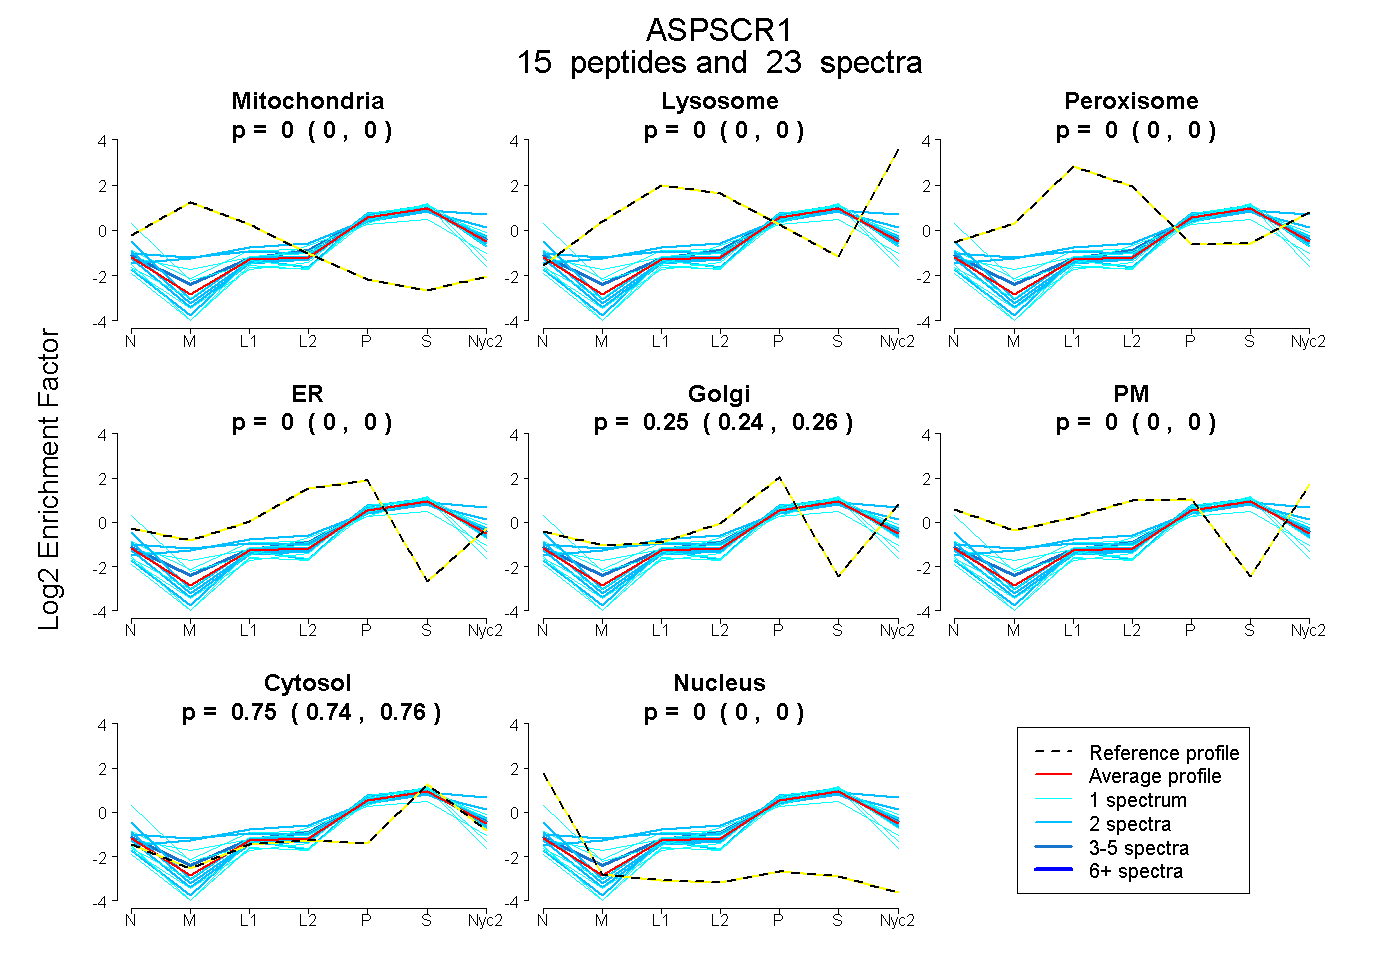
| Plot | Mito | Lyso | Perox | ER | Golgi | PM | Cytosol | Nucleus | |||||
| Expt A |
15 peptides |
23 spectra |
|
0.000 0.000 | 0.000 |
0.000 0.000 | 0.000 |
0.000 0.000 | 0.000 |
0.000 0.000 | 0.000 |
0.251 0.244 | 0.256 |
0.000 0.000 | 0.000 |
0.749 0.743 | 0.755 |
0.000 0.000 | 0.000 |
| 2 spectra, QYDTTGK | 0.000 | 0.000 | 0.000 | 0.000 | 0.320 | 0.000 | 0.680 | 0.000 | ||
| 2 spectra, ESASAPFIPFSGGGQR | 0.000 | 0.000 | 0.000 | 0.000 | 0.167 | 0.000 | 0.833 | 0.000 | ||
| 2 spectra, LGGPSVSLR | 0.000 | 0.000 | 0.000 | 0.000 | 0.231 | 0.000 | 0.769 | 0.000 | ||
| 1 spectrum, DEVTGR | 0.000 | 0.038 | 0.000 | 0.000 | 0.295 | 0.000 | 0.667 | 0.000 | ||
| 2 spectra, LEMVPASR | 0.000 | 0.000 | 0.000 | 0.000 | 0.240 | 0.000 | 0.760 | 0.000 | ||
| 3 spectra, EGPENTVR | 0.000 | 0.000 | 0.000 | 0.000 | 0.288 | 0.000 | 0.712 | 0.000 | ||
| 1 spectrum, FANLPNNAK | 0.000 | 0.015 | 0.000 | 0.000 | 0.321 | 0.000 | 0.664 | 0.000 | ||
| 1 spectrum, LQDSFCSR | 0.000 | 0.000 | 0.000 | 0.193 | 0.118 | 0.000 | 0.591 | 0.098 | ||
| 2 spectra, IALQLDDGCR | 0.000 | 0.017 | 0.059 | 0.000 | 0.293 | 0.000 | 0.630 | 0.000 | ||
| 1 spectrum, TPVCVYMR | 0.000 | 0.000 | 0.000 | 0.000 | 0.081 | 0.000 | 0.919 | 0.000 | ||
| 2 spectra, LQQLGER | 0.000 | 0.227 | 0.000 | 0.000 | 0.184 | 0.000 | 0.589 | 0.000 | ||
| 1 spectrum, SLTSPAAK | 0.000 | 0.000 | 0.000 | 0.000 | 0.143 | 0.000 | 0.857 | 0.000 | ||
| 1 spectrum, TVLDLSLQWR | 0.000 | 0.000 | 0.000 | 0.000 | 0.198 | 0.000 | 0.802 | 0.000 | ||
| 1 spectrum, VLFPDR | 0.000 | 0.000 | 0.000 | 0.000 | 0.202 | 0.000 | 0.798 | 0.000 | ||
| 1 spectrum, GGPKPADAQTK | 0.000 | 0.000 | 0.000 | 0.000 | 0.109 | 0.000 | 0.874 | 0.017 |
| Plot | Mito | Lyso or Perox | ER | Golgi | PM | Cytosol | Nucleus | ||||||
| Expt B |
5 peptides |
8 spectra |
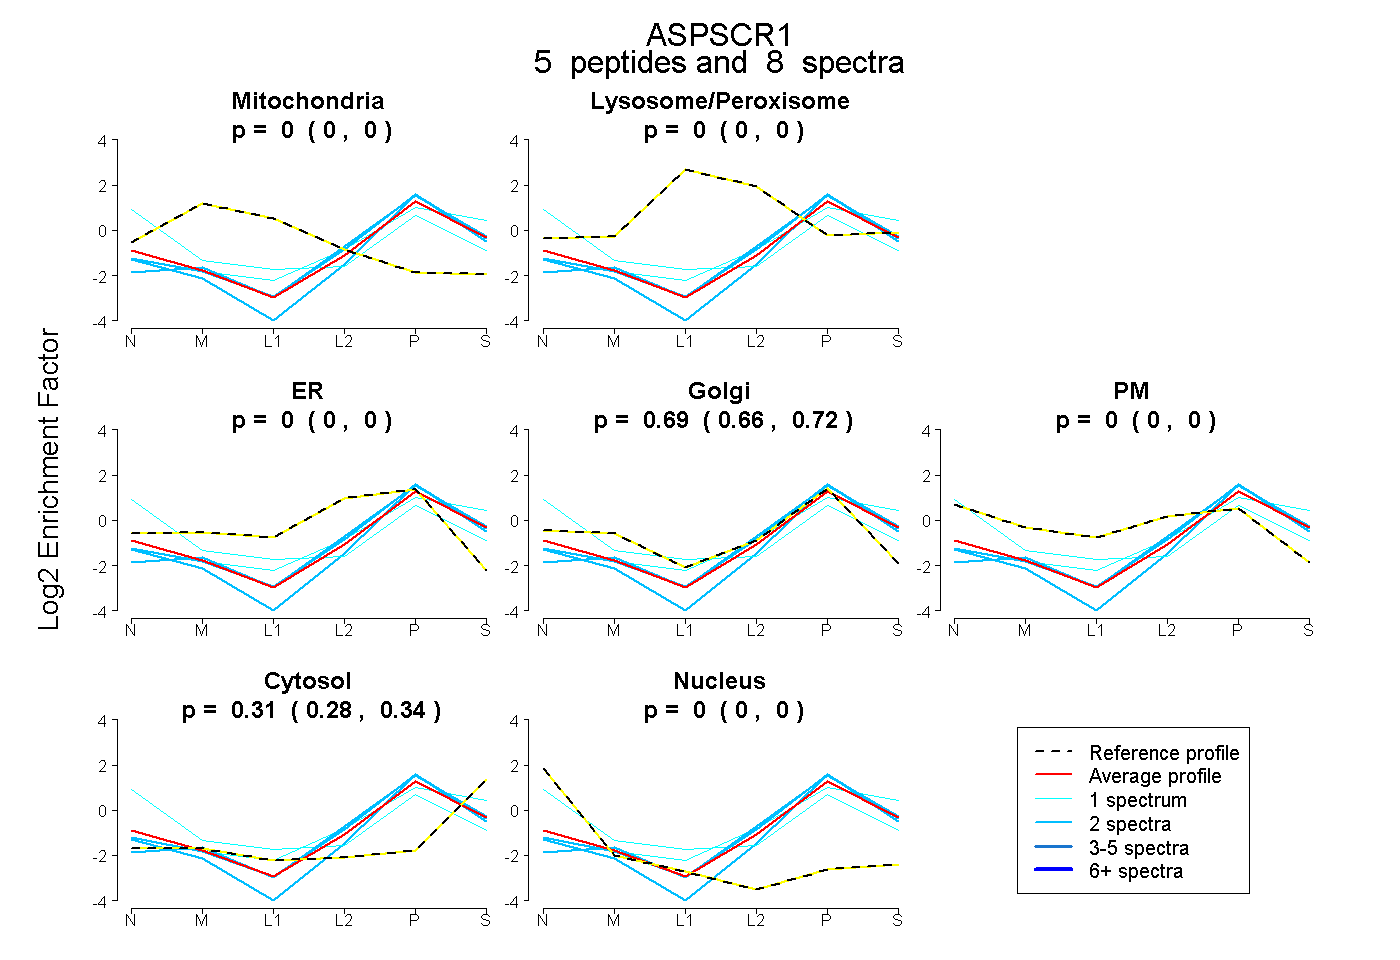 |
0.000 0.000 | 0.000 |
0.000 0.000 | 0.000 |
0.000 0.000 | 0.000 |
0.689 0.657 | 0.715 |
0.000 0.000 | 0.000 |
0.311 0.281 | 0.337 |
0.000 0.000 | 0.000 |
|||
| Plot | Lyso | Other | |||||||||||
| Expt C |
9 peptides |
22 spectra |
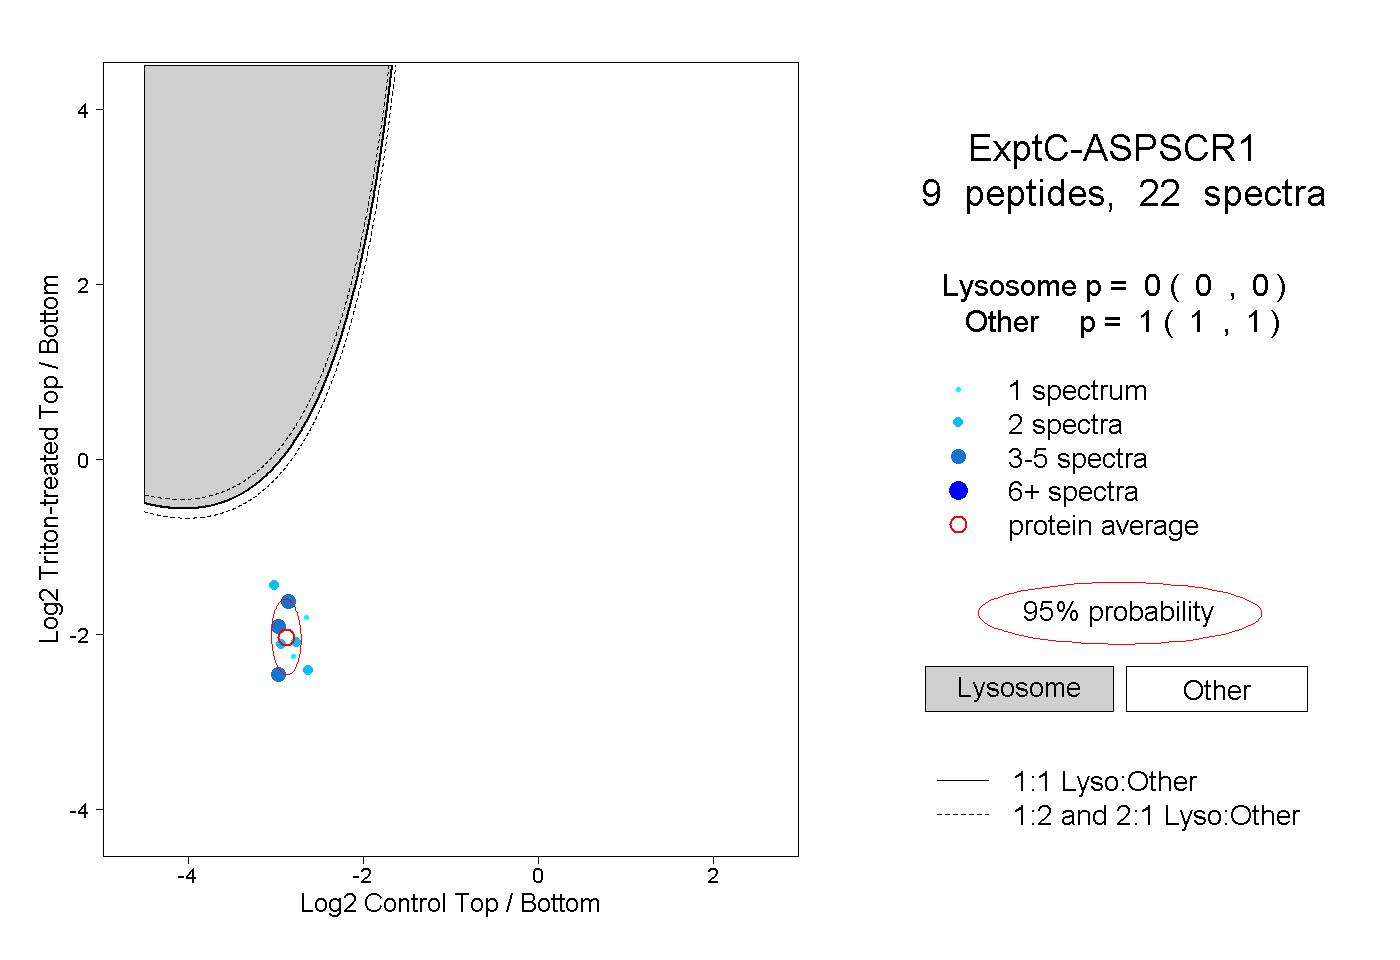 |
0.000 0.000 | 0.000 |
1.000 1.000 | 1.000 |
||||||||
| Plot | Lyso | Other | |||||||||||
| Expt D |
3 peptides |
5 spectra |
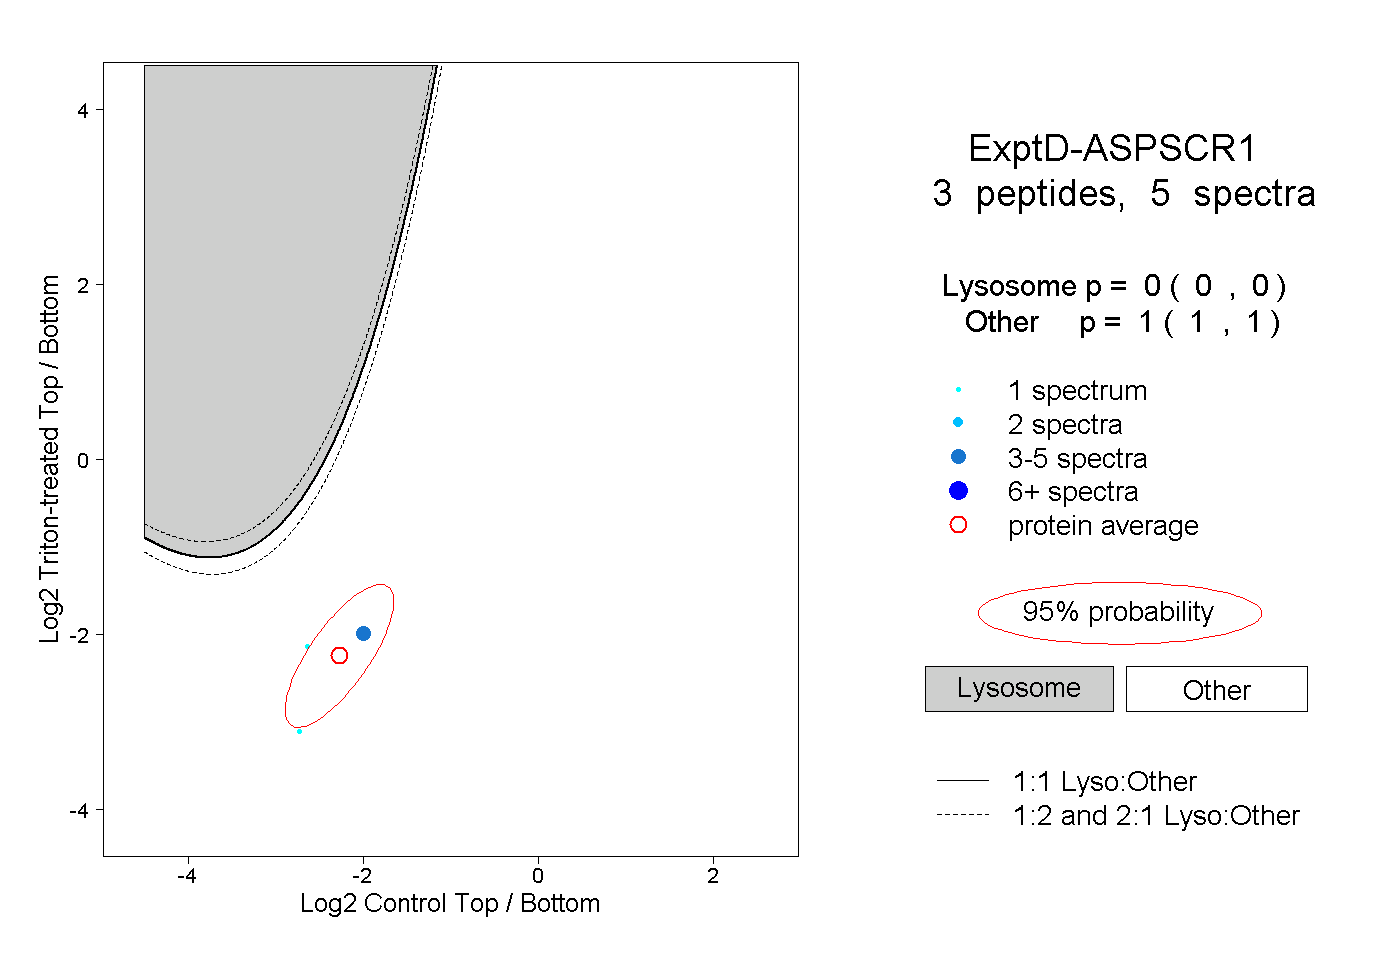 |
0.000 0.000 | 0.000 |
1.000 1.000 | 1.000 |