 8
8peptides
spectra
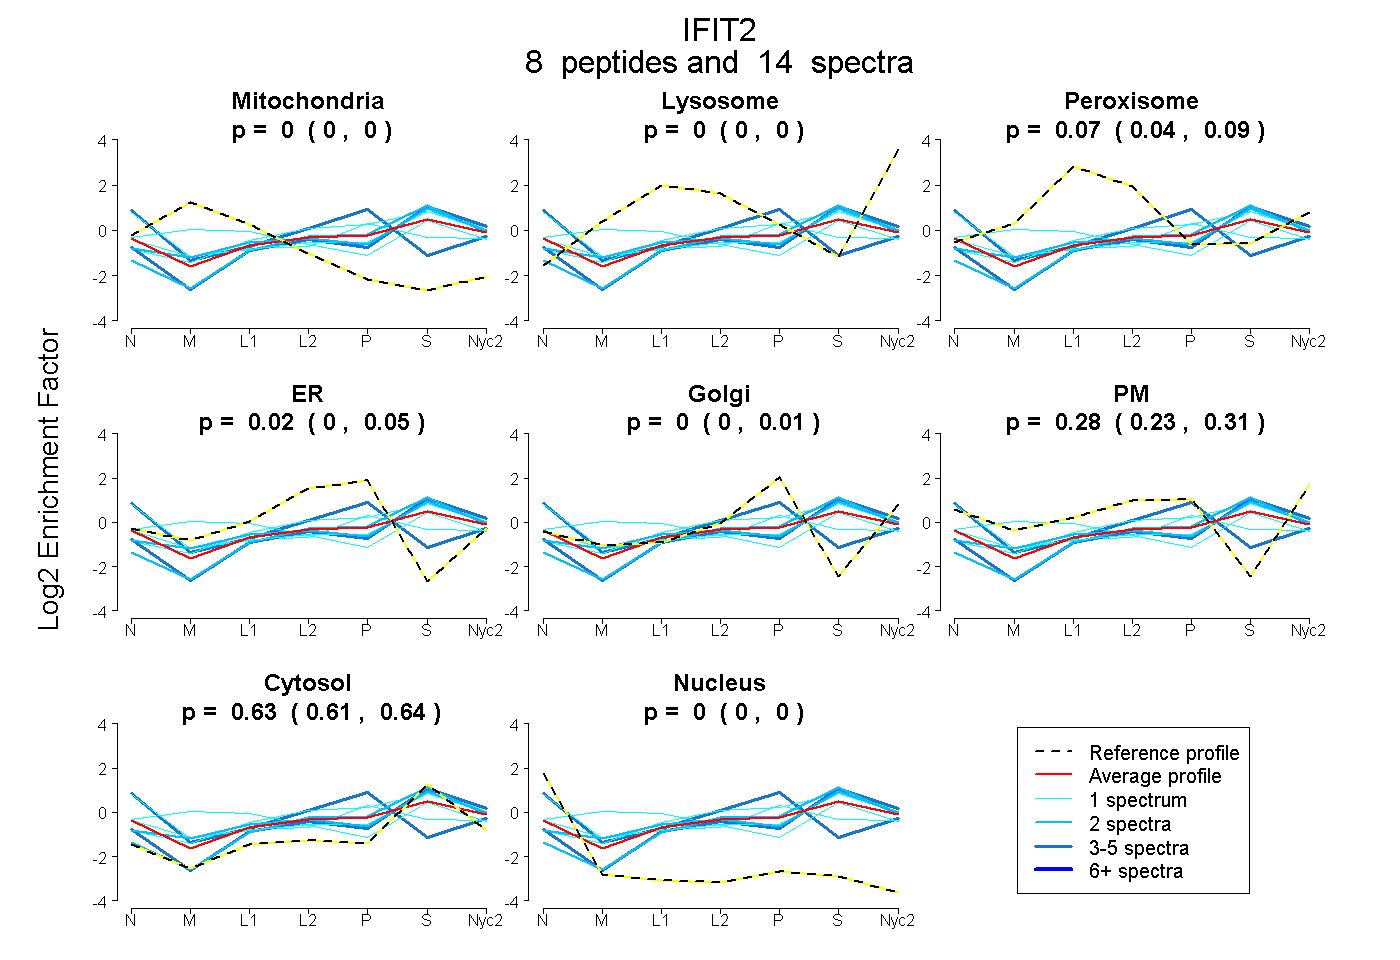
0.000 | 0.000
0.000 | 0.000
0.043 | 0.088
0.000 | 0.054
0.000 | 0.012
0.233 | 0.307
0.609 | 0.644
0.000 | 0.000
1peptide
spectrum

NA | NA
NA | NA
NA | NA
NA | NA
NA | NA
NA | NA
NA | NA
7peptides
spectra
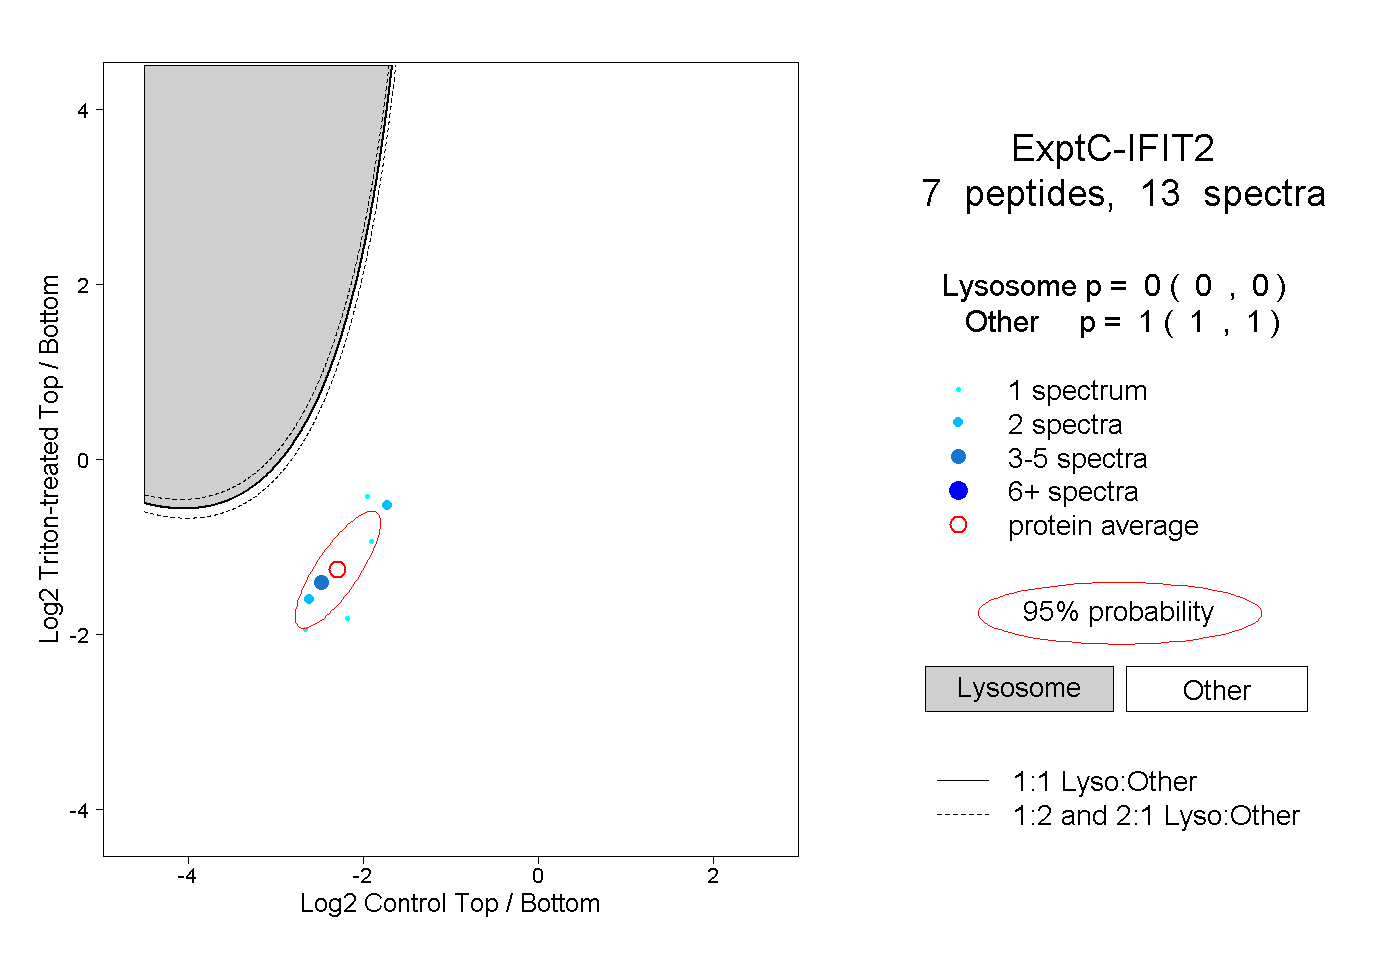
0.000 | 0.000
1.000 | 1.000