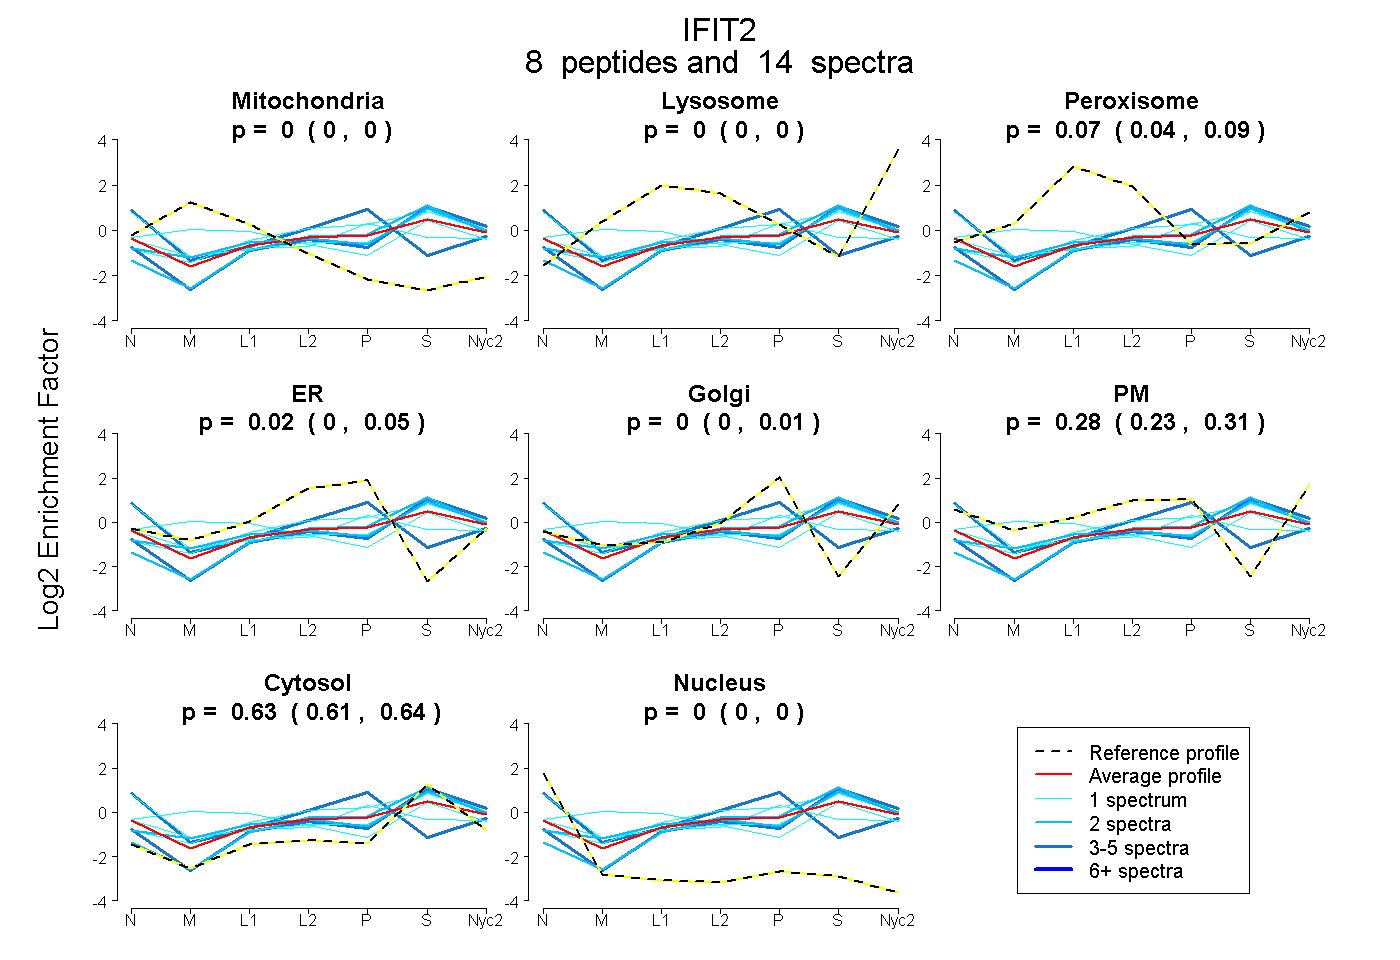
 8
8peptides
spectra
0.000 | 0.000
0.000 | 0.000
0.043 | 0.088
0.000 | 0.054
0.000 | 0.012
0.233 | 0.307
0.609 | 0.644
0.000 | 0.000
| Plot | Mito | Lyso | Perox | ER | Golgi | PM | Cytosol | Nucleus | |||||
| Expt A |
8 peptides |
14 spectra |
|
0.000 0.000 | 0.000 |
0.000 0.000 | 0.000 |
0.066 0.043 | 0.088 |
0.025 0.000 | 0.054 |
0.000 0.000 | 0.012 |
0.280 0.233 | 0.307 |
0.629 0.609 | 0.644 |
0.000 0.000 | 0.000 |
| 2 spectra, VLLAMK | 0.000 | 0.052 | 0.179 | 0.000 | 0.000 | 0.100 | 0.669 | 0.000 | ||
| 3 spectra, AIELIK | 0.000 | 0.000 | 0.000 | 0.270 | 0.050 | 0.344 | 0.212 | 0.124 | ||
| 1 spectrum, LEALIQPALNHLR | 0.000 | 0.130 | 0.100 | 0.123 | 0.075 | 0.000 | 0.573 | 0.000 | ||
| 1 spectrum, ELVEEALK | 0.253 | 0.028 | 0.251 | 0.000 | 0.000 | 0.010 | 0.458 | 0.000 | ||
| 3 spectra, LEEVHENR | 0.000 | 0.087 | 0.000 | 0.000 | 0.000 | 0.122 | 0.791 | 0.000 | ||
| 2 spectra, QLLHLR | 0.000 | 0.106 | 0.000 | 0.121 | 0.000 | 0.000 | 0.773 | 0.000 | ||
| 1 spectrum, ATMCNLLAYVK | 0.000 | 0.000 | 0.000 | 0.012 | 0.017 | 0.453 | 0.387 | 0.131 | ||
| 1 spectrum, QQHPDQIEIK | 0.000 | 0.000 | 0.104 | 0.000 | 0.000 | 0.230 | 0.667 | 0.000 |
| Plot | Mito | Lyso or Perox | ER | Golgi | PM | Cytosol | Nucleus | ||||||
| Expt B |
1 peptide |
1 spectrum |
 |
0.000 NA | NA |
0.064 NA | NA |
0.000 NA | NA |
0.000 NA | NA |
0.089 NA | NA |
0.847 NA | NA |
0.000 NA | NA |
|||
| Plot | Lyso | Other | |||||||||||
| Expt C |
7 peptides |
13 spectra |
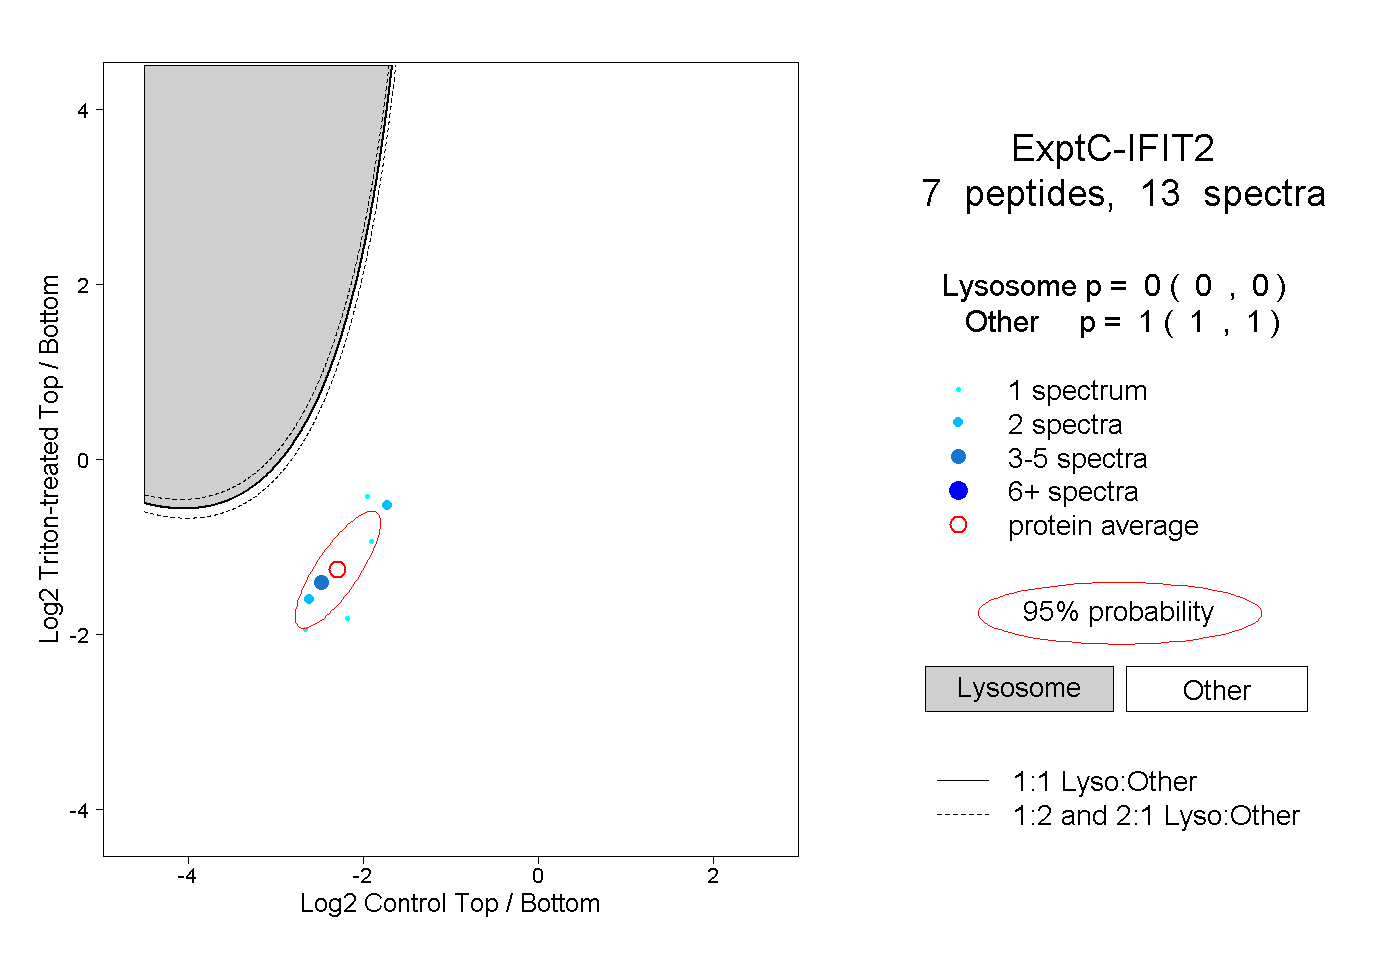 |
0.000 0.000 | 0.000 |
1.000 1.000 | 1.000 |