 4
4peptides
spectra

0.000 | 0.000
0.168 | 0.202
0.000 | 0.000
0.027 | 0.064
0.457 | 0.509
0.026 | 0.072
0.214 | 0.245
0.000 | 0.000
2peptides
spectra

0.000 | 0.000
0.113 | 0.353
0.032 | 0.443
0.225 | 0.520
0.000 | 0.000
0.041 | 0.171
0.000 | 0.000
10peptides
spectra
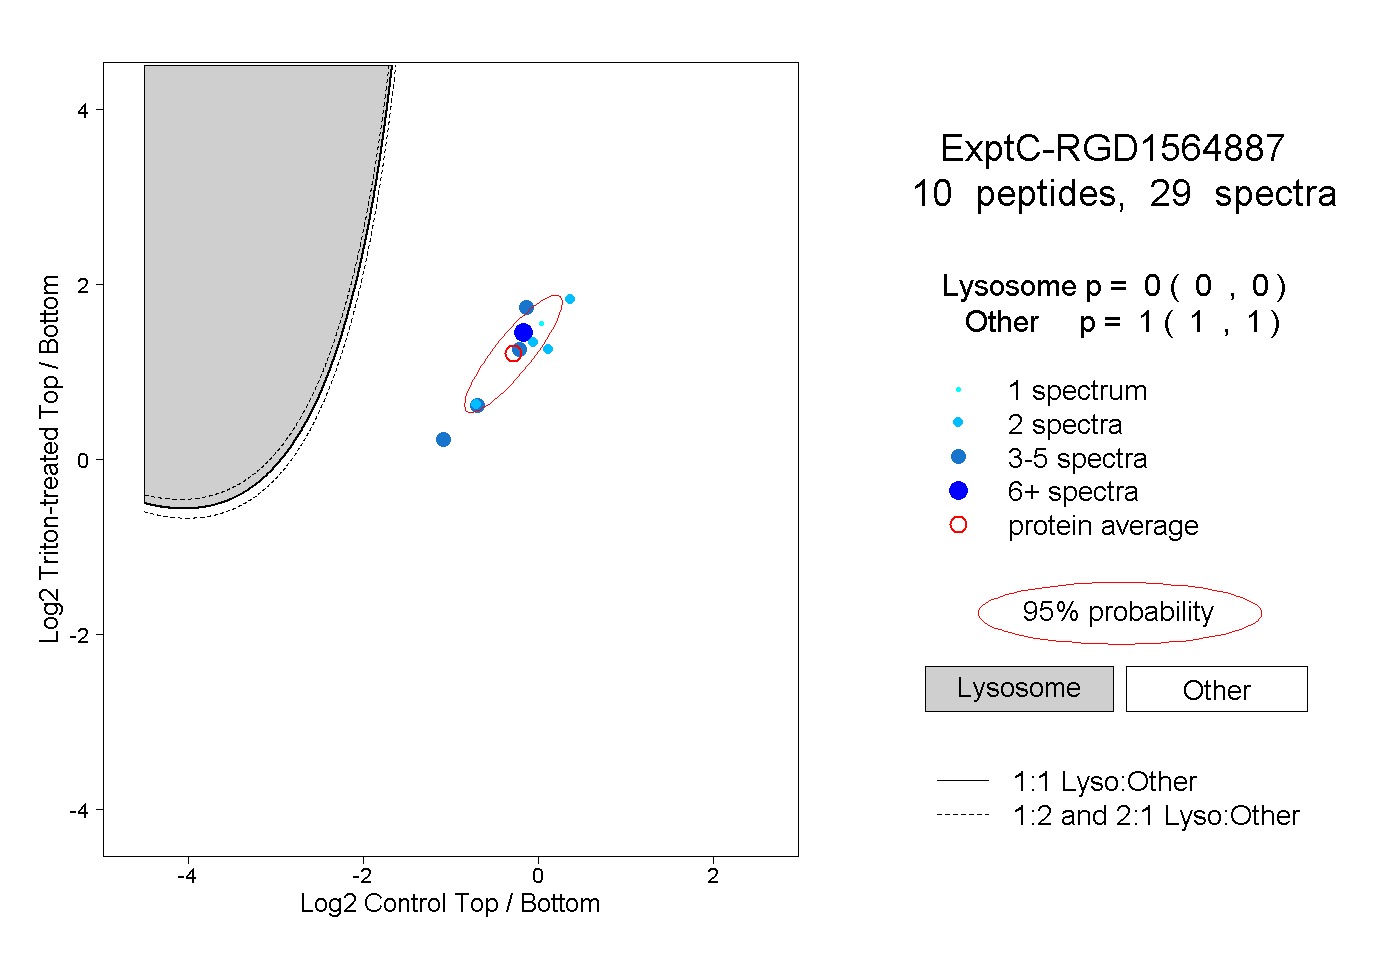
0.000 | 0.000
1.000 | 1.000