 4
4peptides
spectra

0.000 | 0.000
0.168 | 0.202
0.000 | 0.000
0.027 | 0.064
0.457 | 0.509
0.026 | 0.072
0.214 | 0.245
0.000 | 0.000
| Plot | Mito | Lyso | Perox | ER | Golgi | PM | Cytosol | Nucleus | |||||
| Expt A |
4 peptides |
11 spectra |
|
0.000 0.000 | 0.000 |
0.187 0.168 | 0.202 |
0.000 0.000 | 0.000 |
0.048 0.027 | 0.064 |
0.483 0.457 | 0.509 |
0.051 0.026 | 0.072 |
0.231 0.214 | 0.245 |
0.000 0.000 | 0.000 |
| 3 spectra, VTHALVNIR | 0.000 | 0.152 | 0.107 | 0.000 | 0.493 | 0.137 | 0.111 | 0.000 | ||
| 2 spectra, LQDGLDQYER | 0.000 | 0.180 | 0.000 | 0.015 | 0.527 | 0.000 | 0.278 | 0.000 | ||
| 2 spectra, FWEELFLMK | 0.000 | 0.092 | 0.000 | 0.025 | 0.549 | 0.055 | 0.279 | 0.000 | ||
| 4 spectra, EAAFFK | 0.000 | 0.227 | 0.000 | 0.055 | 0.468 | 0.019 | 0.231 | 0.000 |
| Plot | Mito | Lyso or Perox | ER | Golgi | PM | Cytosol | Nucleus | ||||||
| Expt B |
2 peptides |
3 spectra |
 |
0.000 0.000 | 0.000 |
0.240 0.113 | 0.353 |
0.264 0.032 | 0.443 |
0.383 0.225 | 0.520 |
0.000 0.000 | 0.000 |
0.113 0.041 | 0.171 |
0.000 0.000 | 0.000 |
|||
| Plot | Lyso | Other | |||||||||||
| Expt C |
10 peptides |
29 spectra |
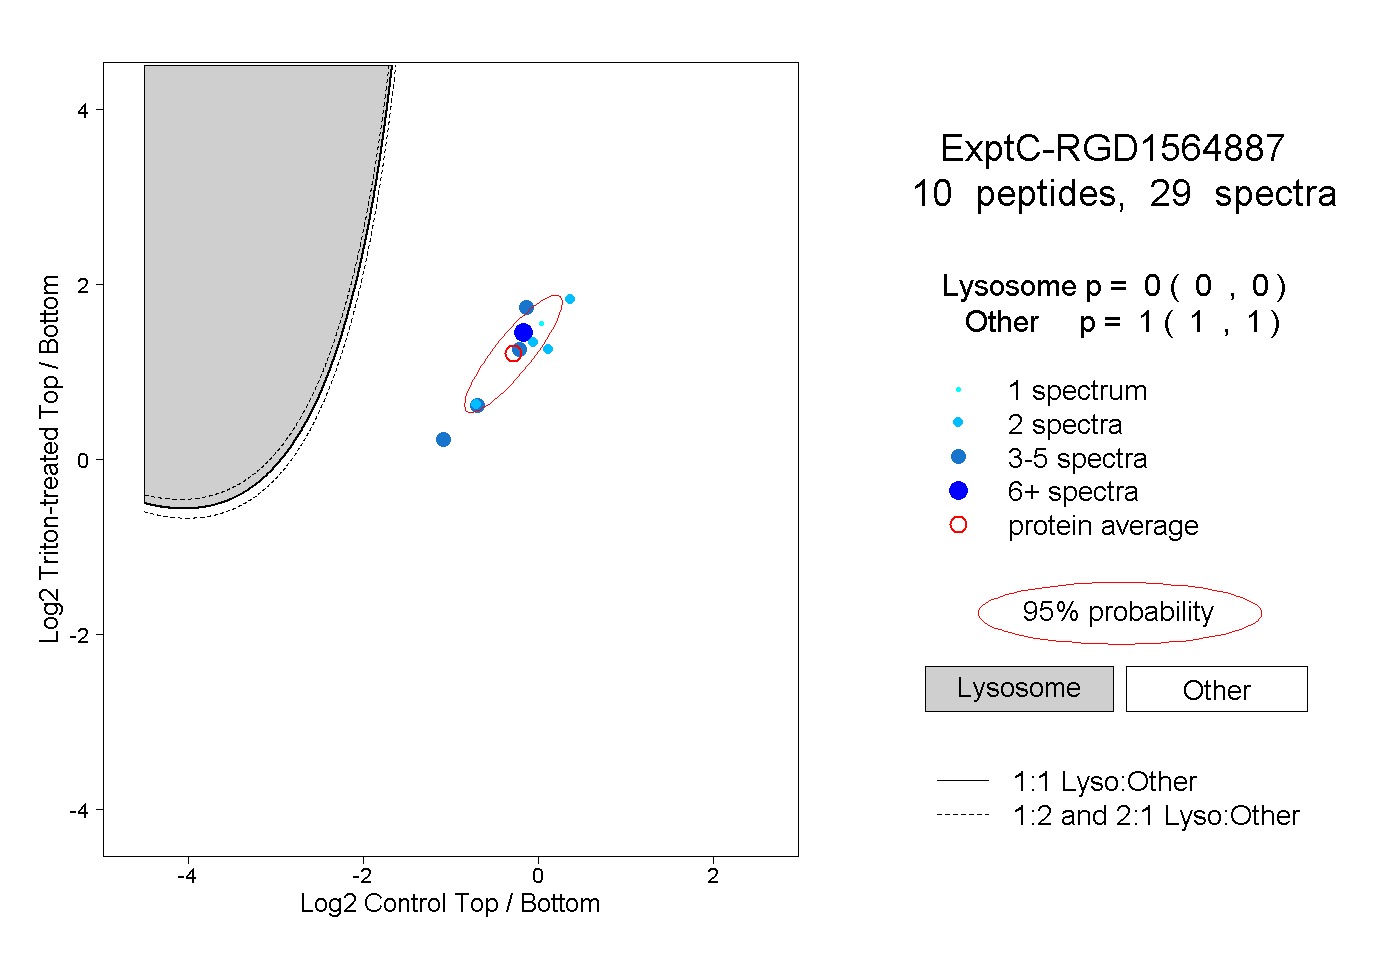 |
0.000 0.000 | 0.000 |
1.000 1.000 | 1.000 |