 7
7peptides
spectra
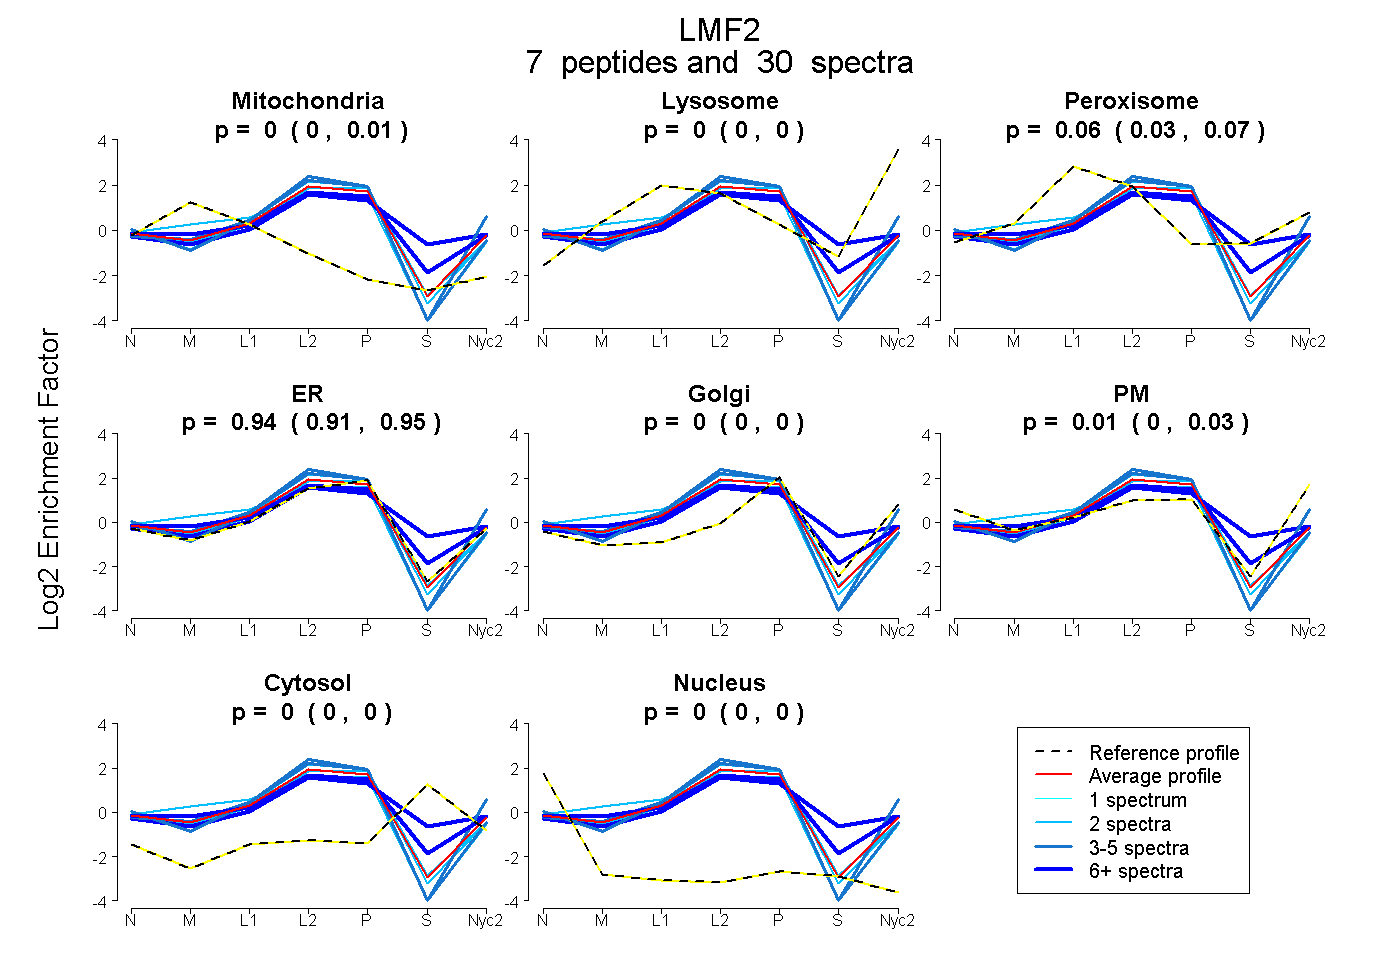
0.000 | 0.007
0.000 | 0.000
0.033 | 0.074
0.913 | 0.949
0.000 | 0.000
0.000 | 0.029
0.000 | 0.000
0.000 | 0.000
5peptides
spectra
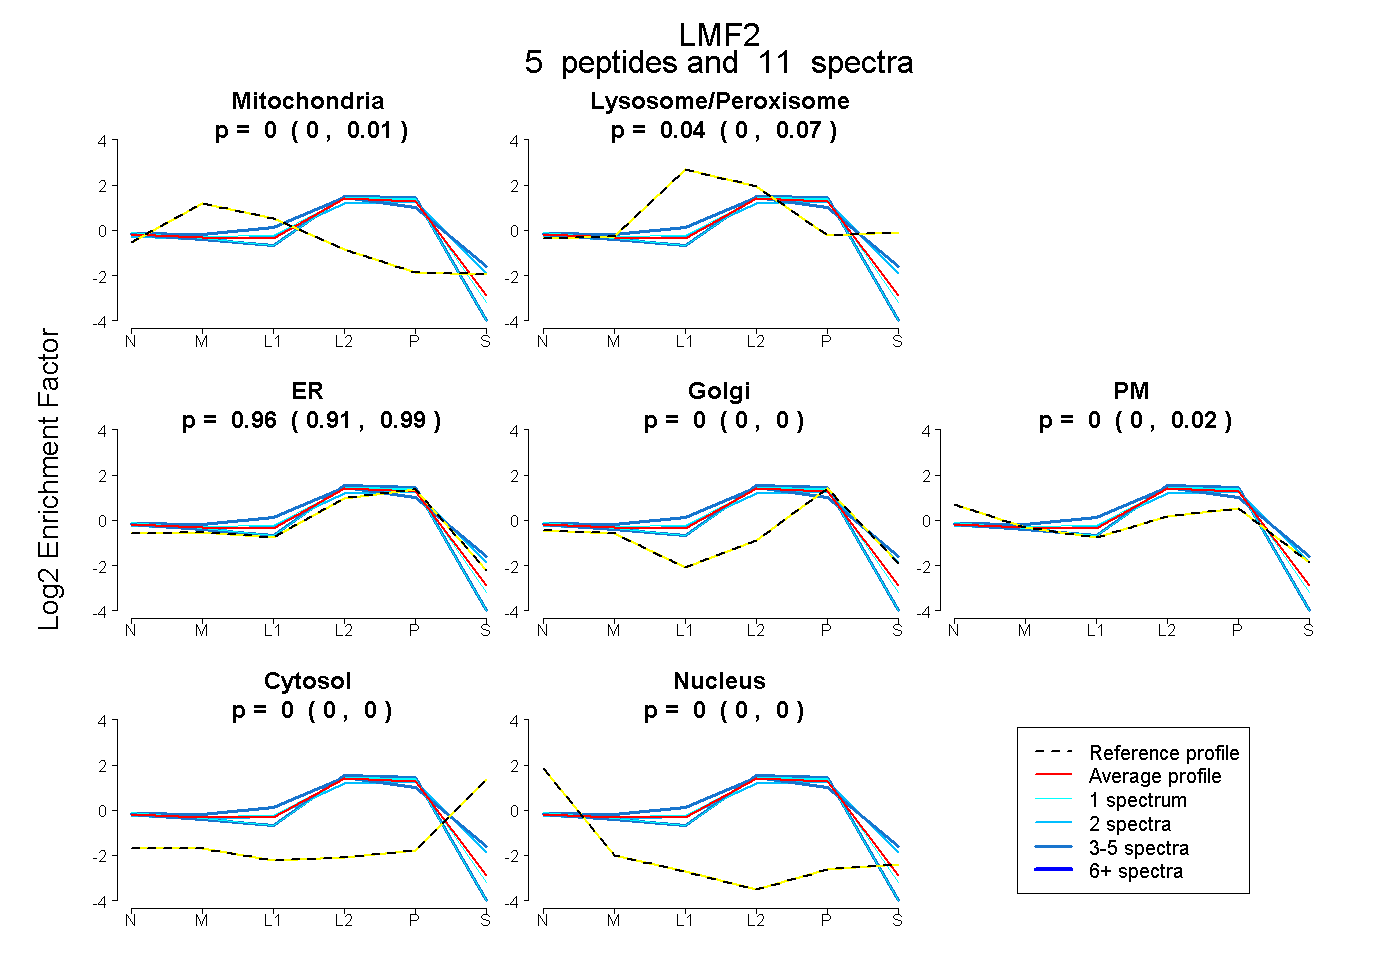
0.000 | 0.008
0.000 | 0.067
0.907 | 0.990
0.000 | 0.000
0.000 | 0.023
0.000 | 0.000
0.000 | 0.000
8peptides
spectra
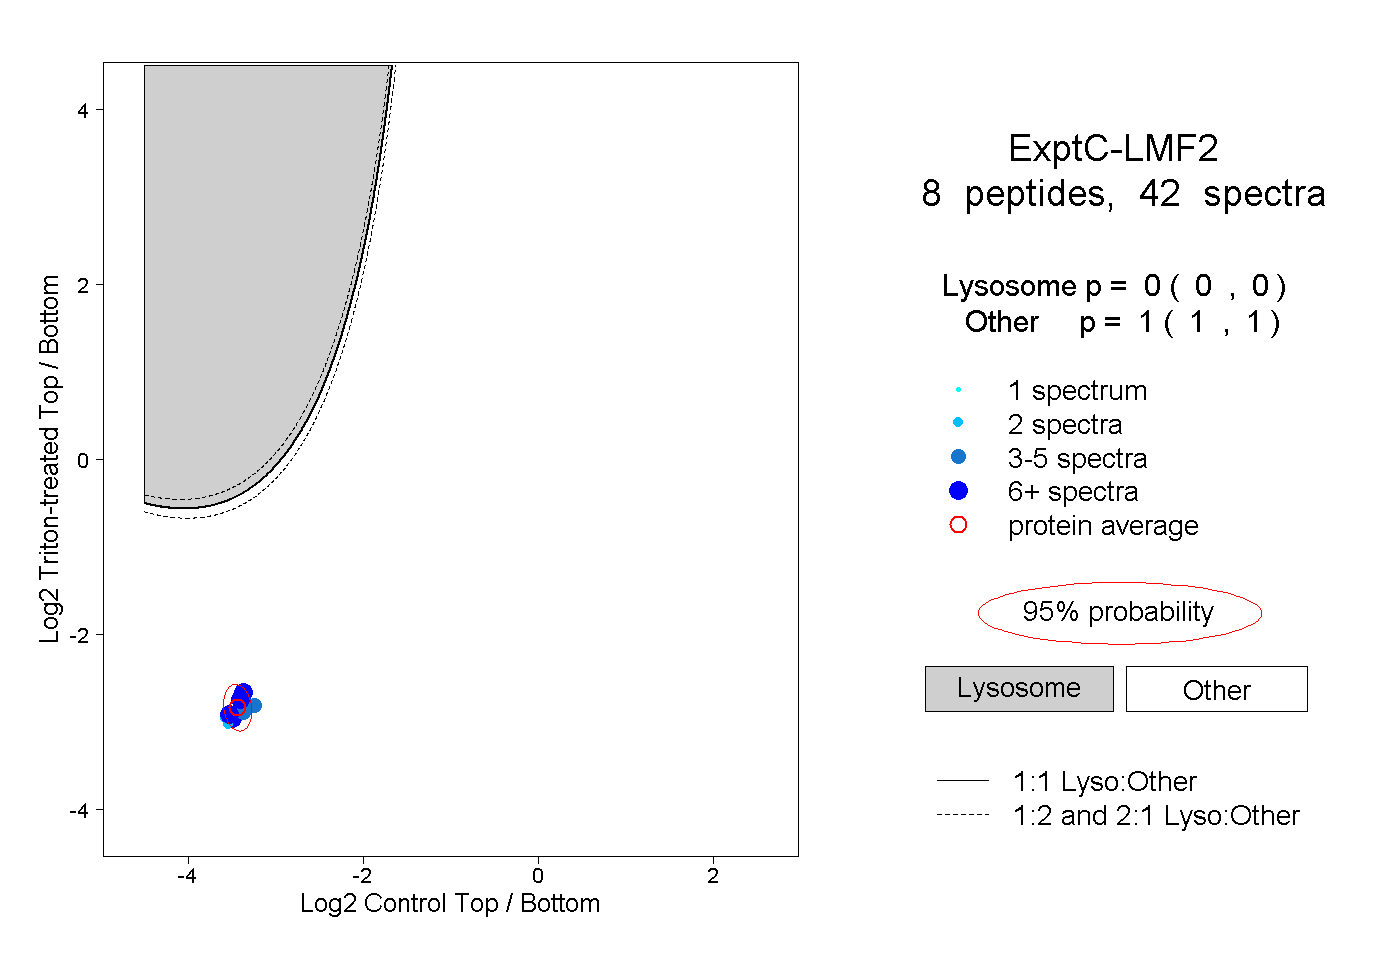
0.000 | 0.000
1.000 | 1.000
1peptide
spectra
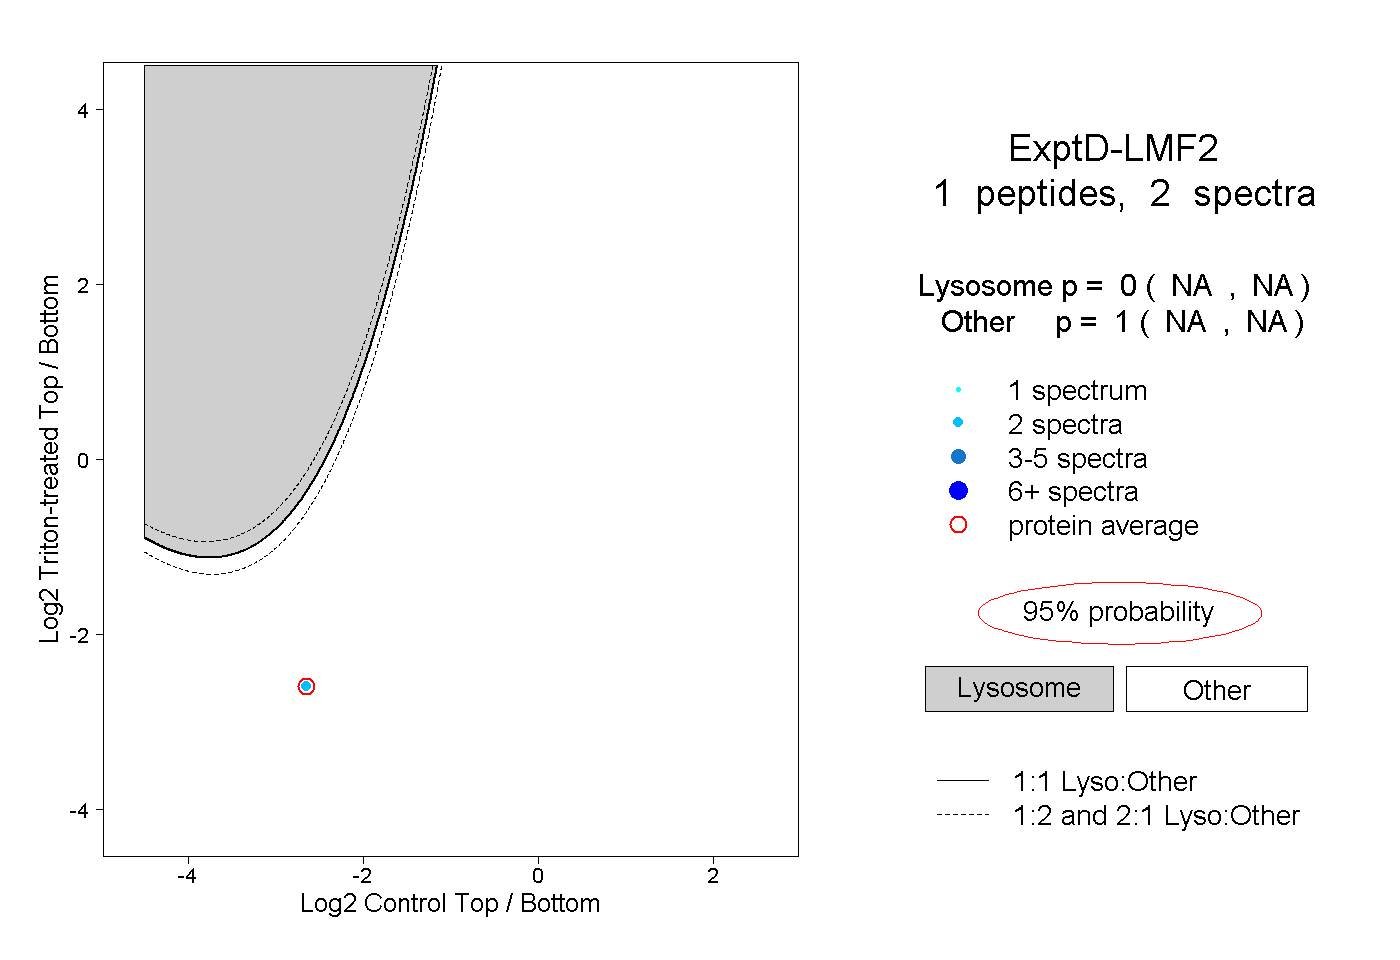
NA | NA
NA | NA