LMF2
[ENSRNOP00000051363]
Main page
| | | Plot |
Mito |
Lyso |
|
Perox |
ER |
Golgi |
PM |
Cytosol |
Nucleus |
|
| Expt A |
 7
7
peptides |
30
spectra |
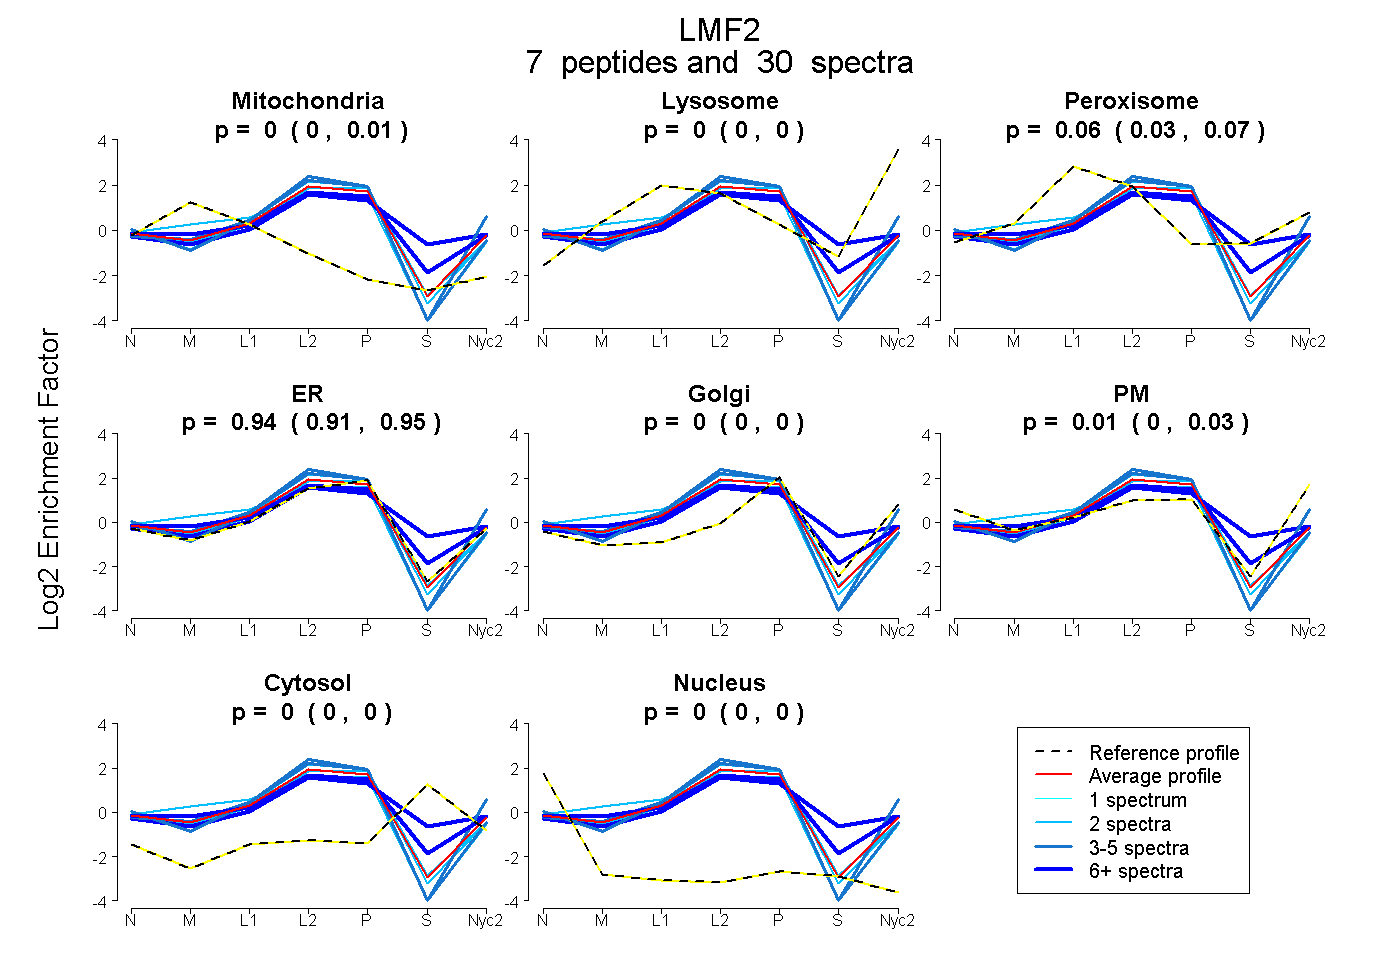 |
0.000
0.000 | 0.007 |
0.000
0.000 | 0.000 |
|
0.057
0.033 | 0.074 |
0.935
0.913 | 0.949 |
0.000
0.000 | 0.000 |
0.008
0.000 | 0.029 |
0.000
0.000 | 0.000 |
0.000
0.000 | 0.000 |
|
| | | Plot |
Mito |
|
Lyso or Perox |
|
ER |
Golgi |
PM |
Cytosol |
Nucleus |
|
| Expt B |
5
peptides |
11
spectra |
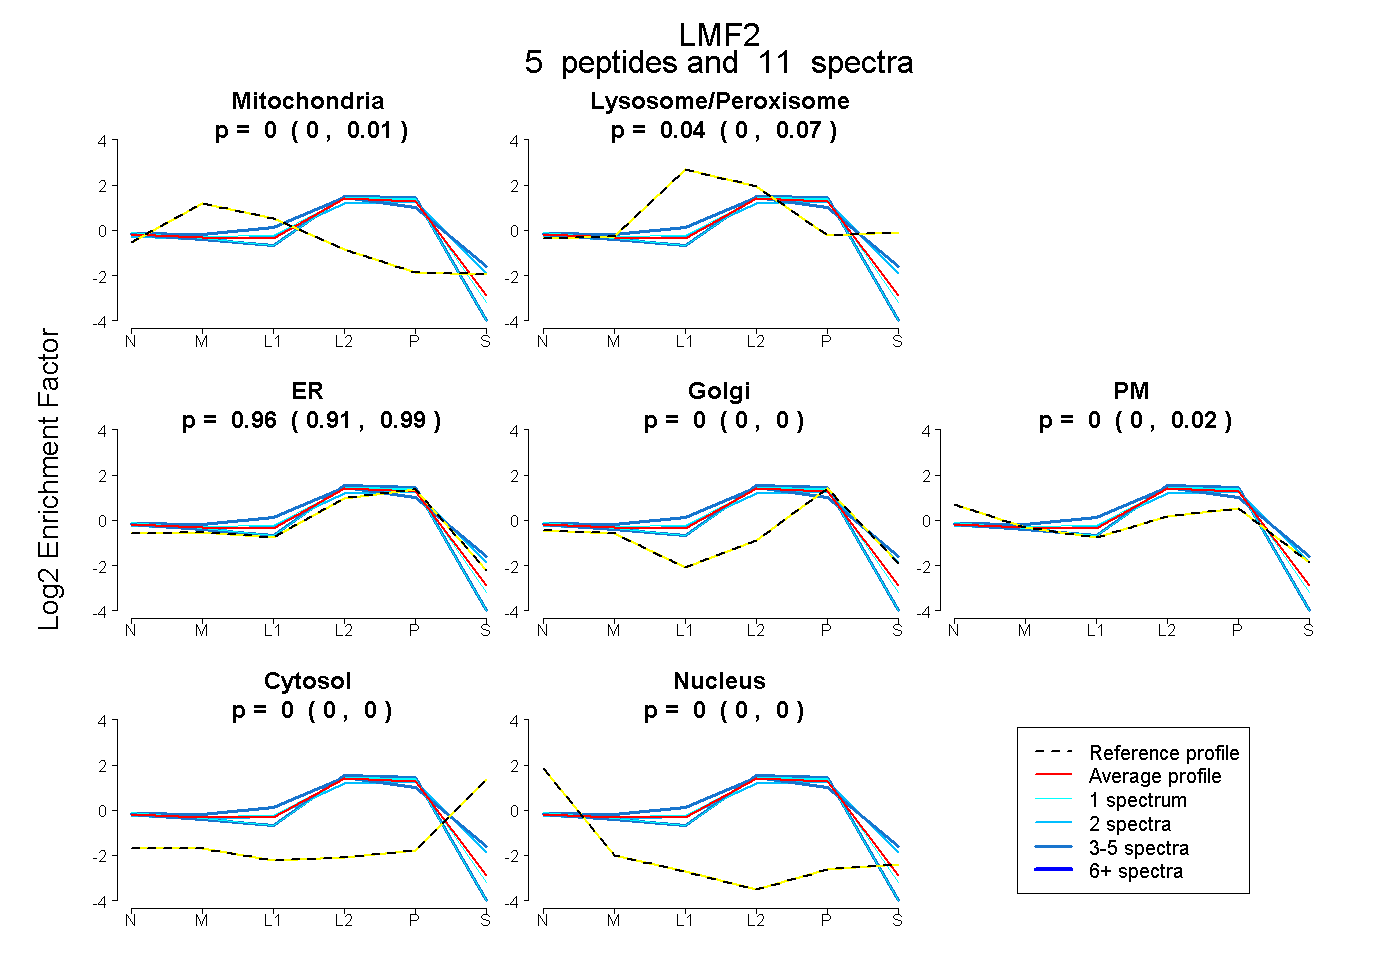 |
0.000
0.000 | 0.008 |
|
0.036
0.000 | 0.067 |
|
0.964
0.907 | 0.990 |
0.000
0.000 | 0.000 |
0.000
0.000 | 0.023 |
0.000
0.000 | 0.000 |
0.000
0.000 | 0.000 |
|
| 3 spectra, LWTGAHR |
0.000 |
|
0.270 |
|
0.619 |
0.000 |
0.112 |
0.000 |
0.000 |
|
| 1 spectrum, TLRPQGK |
0.002 |
|
0.015 |
|
0.983 |
0.000 |
0.000 |
0.000 |
0.000 |
|
| 2 spectra, EQPPTYLR |
0.000 |
|
0.133 |
|
0.787 |
0.000 |
0.081 |
0.000 |
0.000 |
|
| 1 spectrum, TLLTPRPLQSSK |
0.000 |
|
0.000 |
|
1.000 |
0.000 |
0.000 |
0.000 |
0.000 |
|
| 4 spectra, LIQNQVANYPFR |
0.000 |
|
0.000 |
|
1.000 |
0.000 |
0.000 |
0.000 |
0.000 |
|
| | | Plot |
|
Lyso |
|
|
|
|
|
|
|
Other |
| Expt C |
8
peptides |
42
spectra |
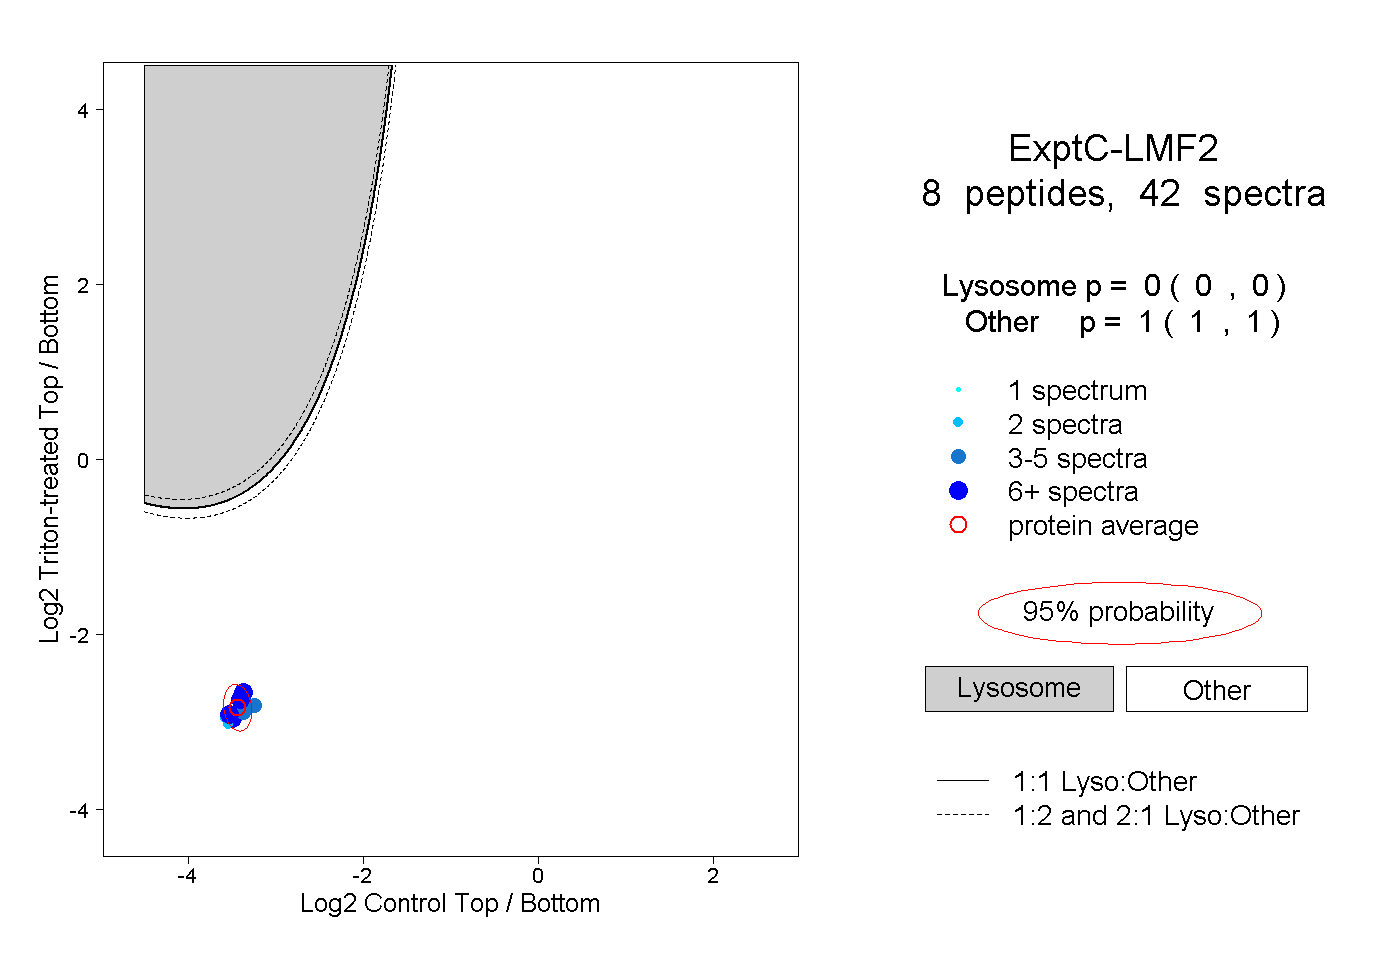 |
|
0.000
0.000 | 0.000 |
|
|
|
|
|
|
|
1.000
1.000 | 1.000 |
| | | Plot |
|
Lyso |
|
|
|
|
|
|
|
Other |
| Expt D |
1
peptide |
2
spectra |
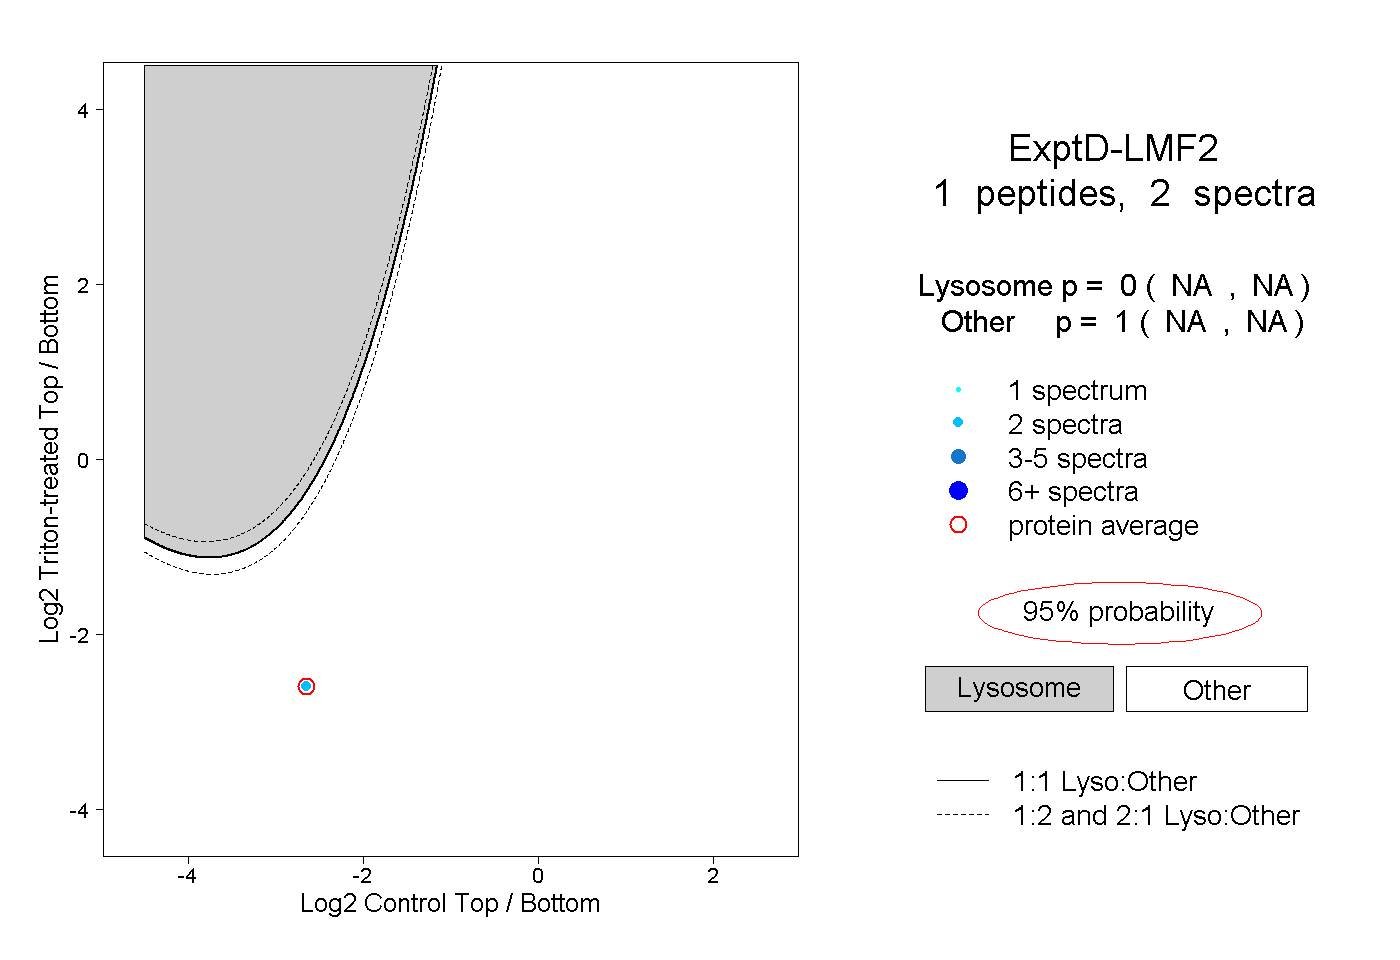 |
|
0.000
NA | NA |
|
|
|
|
|
|
|
1.000
NA | NA |