 2
2peptides
spectra
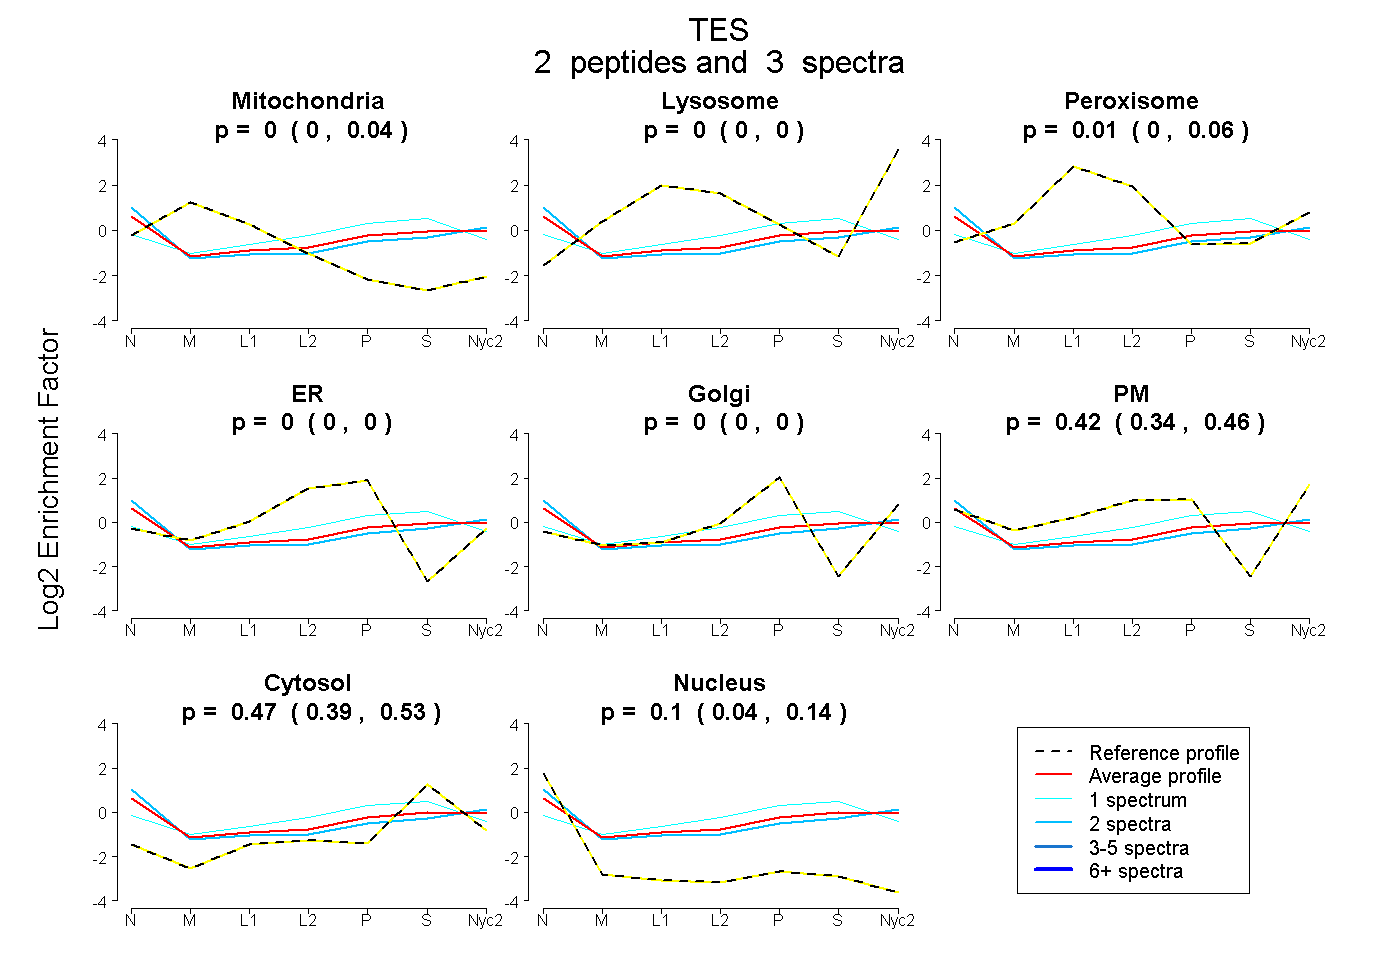
0.000 | 0.040
0.000 | 0.000
0.000 | 0.059
0.000 | 0.000
0.000 | 0.000
0.343 | 0.461
0.390 | 0.529
0.040 | 0.144
1peptide
spectra
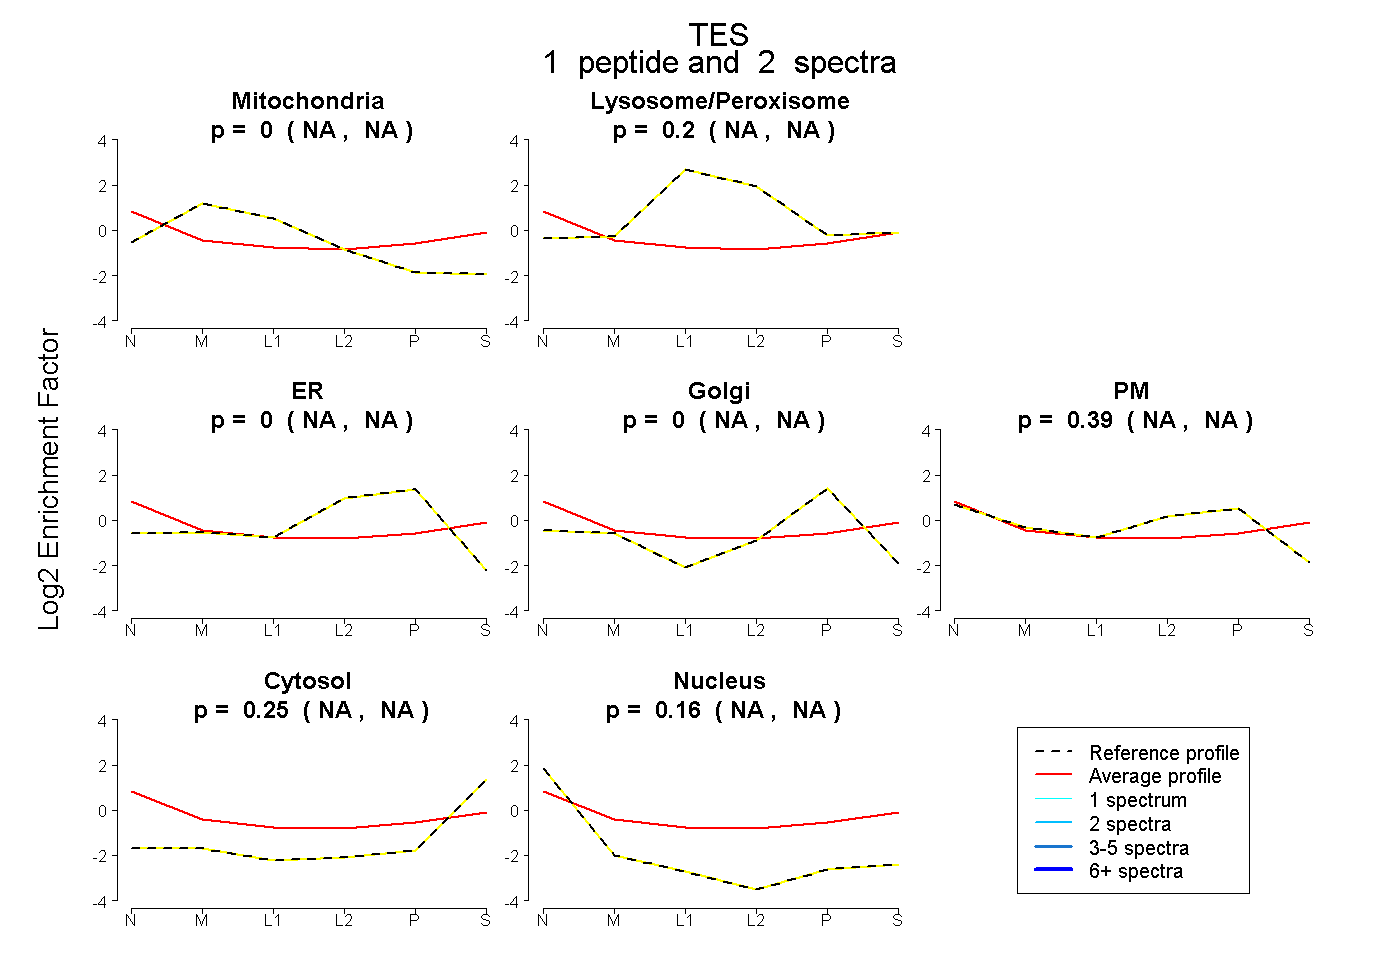
NA | NA
NA | NA
NA | NA
NA | NA
NA | NA
NA | NA
NA | NA
3peptides
spectra
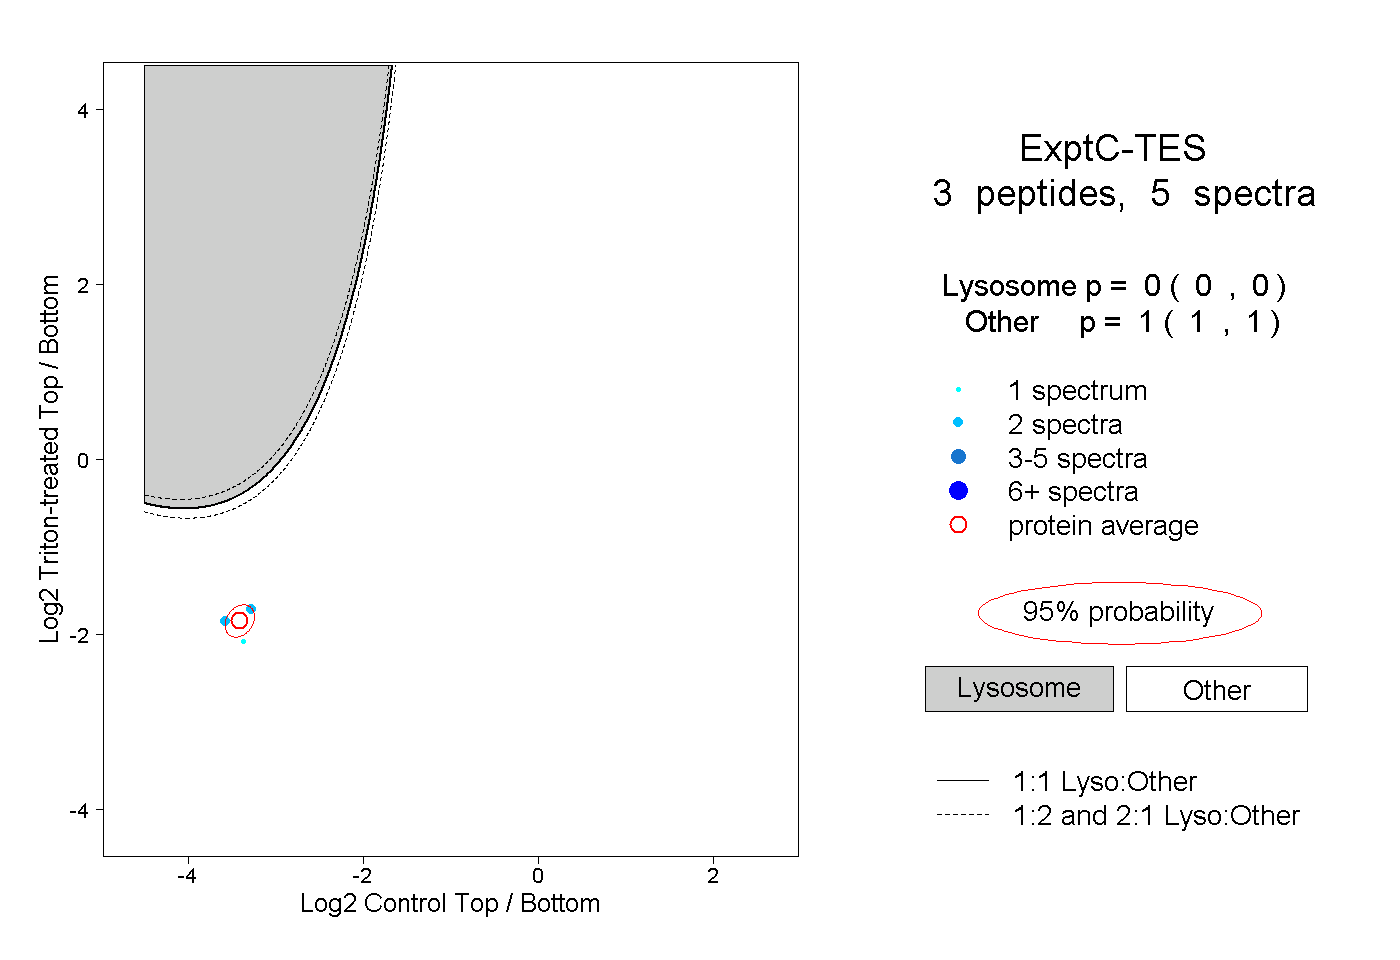
0.000 | 0.000
1.000 | 1.000
1peptide
spectra
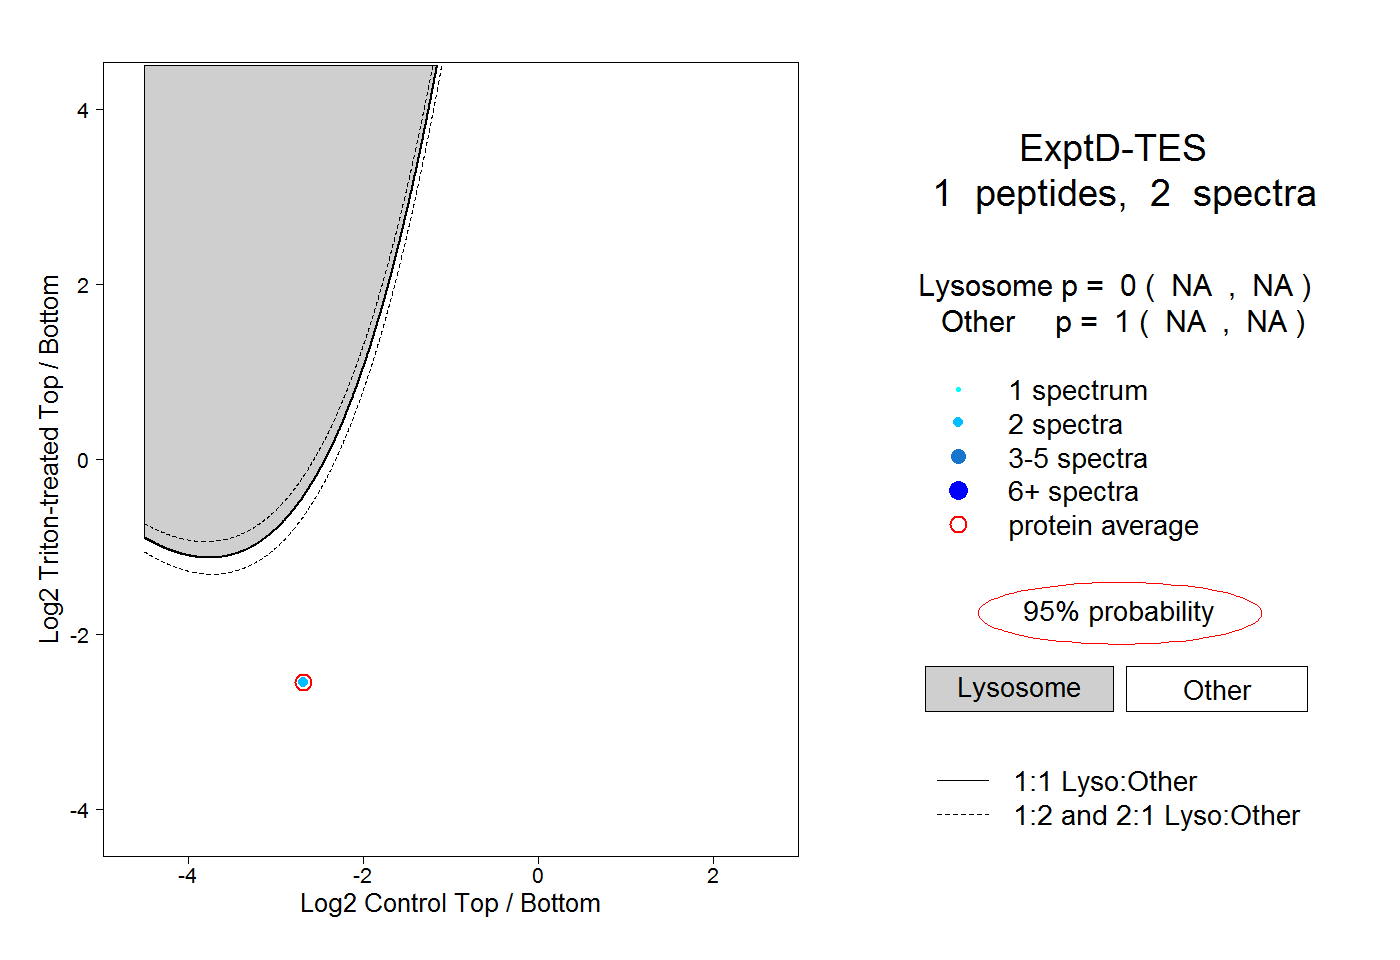
NA | NA
NA | NA