 2
2peptides
spectra
0.000 | 0.040
0.000 | 0.000
0.000 | 0.059
0.000 | 0.000
0.000 | 0.000
0.343 | 0.461
0.390 | 0.529
0.040 | 0.144
| Plot | Mito | Lyso | Perox | ER | Golgi | PM | Cytosol | Nucleus | |||||
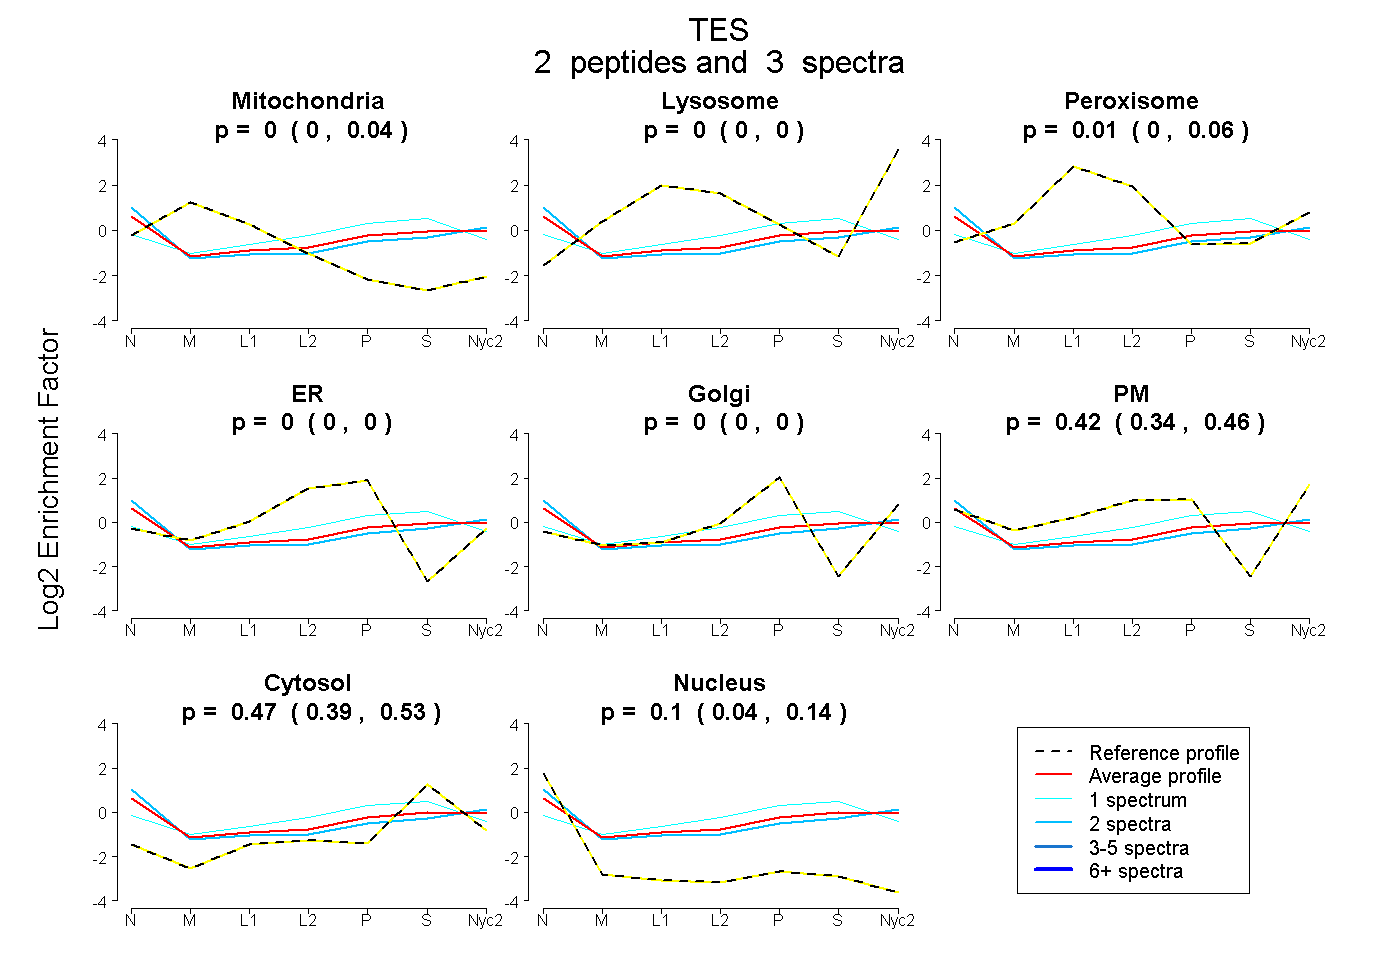
| Expt A |
2 peptides |
3 spectra |
|
0.000 0.000 | 0.040 |
0.000 0.000 | 0.000 |
0.006 0.000 | 0.059 |
0.000 0.000 | 0.000 |
0.000 0.000 | 0.000 |
0.424 0.343 | 0.461 |
0.469 0.390 | 0.529 |
0.101 0.040 | 0.144 |
| 1 spectrum, NHAVVCQGCHNAIDPEVQR | 0.000 | 0.000 | 0.109 | 0.151 | 0.072 | 0.124 | 0.544 | 0.000 | ||
| 2 spectra, EGDPAIYAER | 0.000 | 0.000 | 0.000 | 0.000 | 0.000 | 0.437 | 0.397 | 0.166 |
| Plot | Mito | Lyso or Perox | ER | Golgi | PM | Cytosol | Nucleus | ||||||
| Expt B |
1 peptide |
2 spectra |
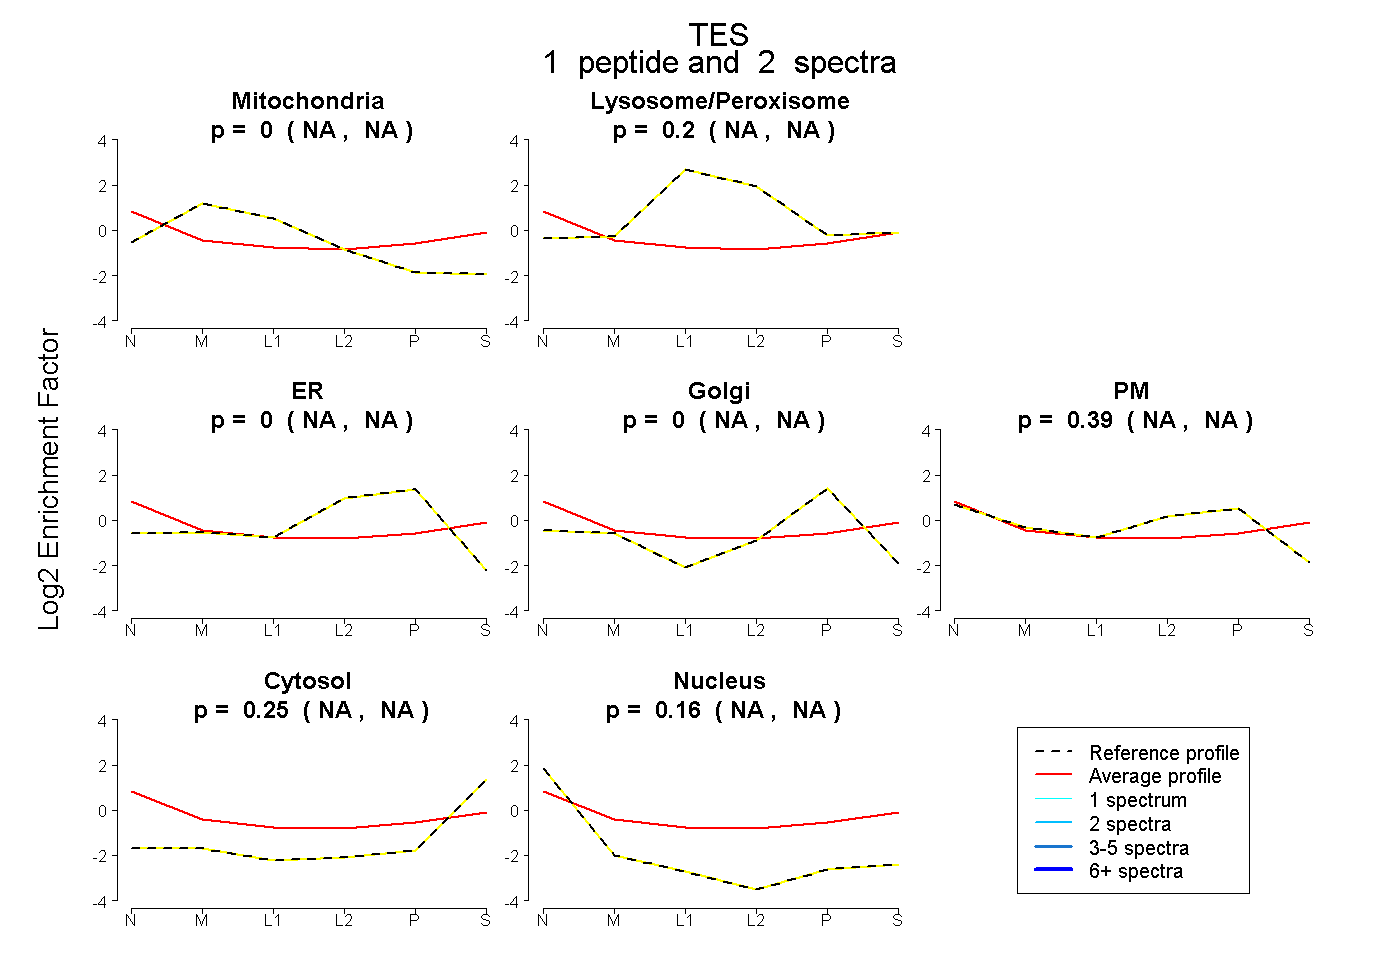 |
0.000 NA | NA |
0.201 NA | NA |
0.000 NA | NA |
0.000 NA | NA |
0.391 NA | NA |
0.246 NA | NA |
0.162 NA | NA |
|||
| Plot | Lyso | Other | |||||||||||
| Expt C |
3 peptides |
5 spectra |
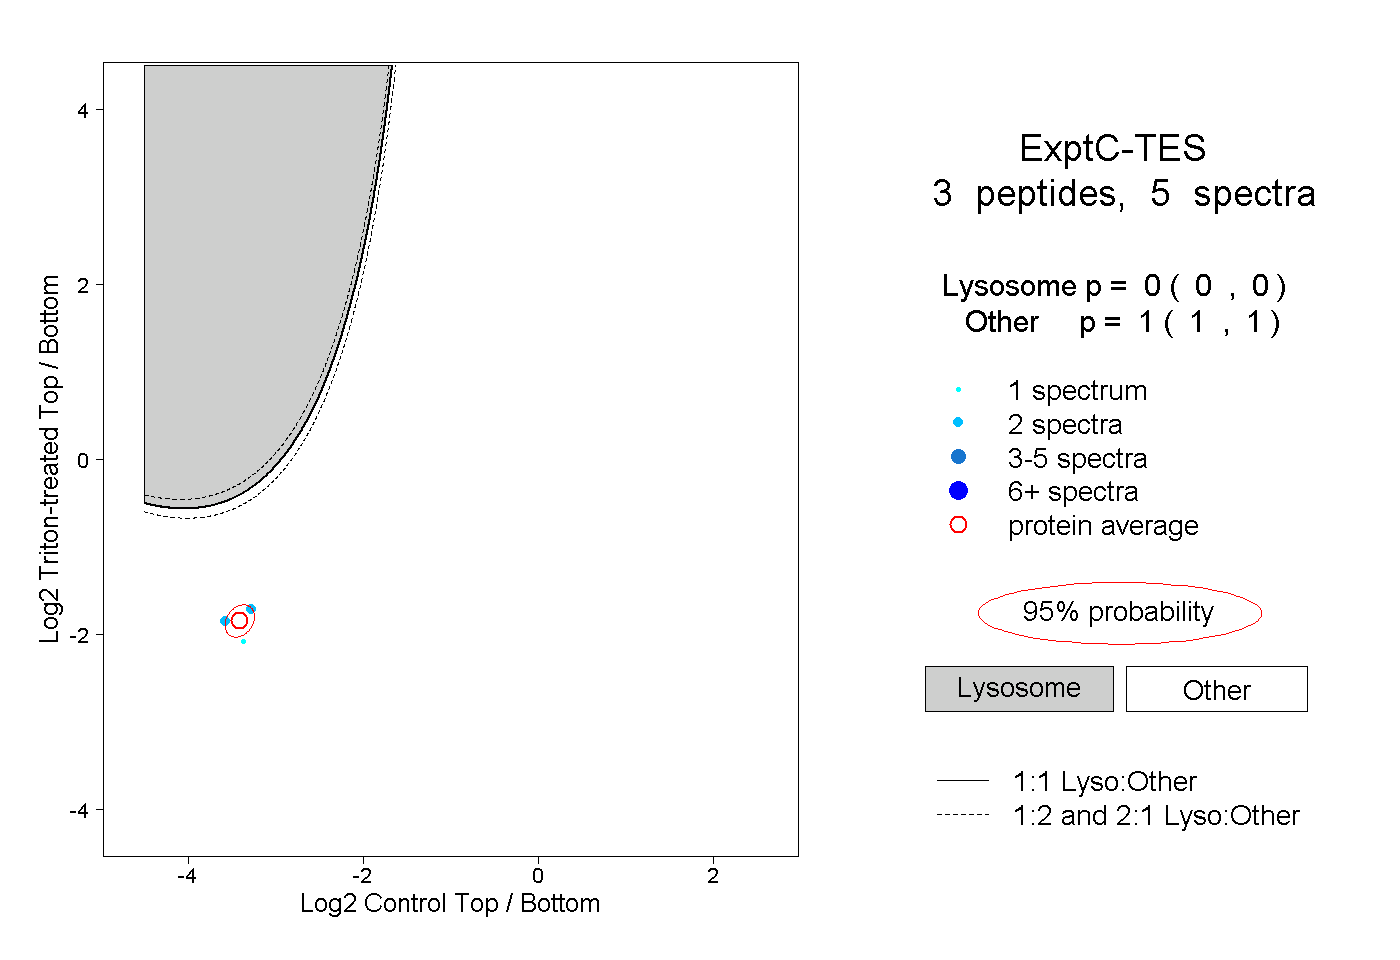 |
0.000 0.000 | 0.000 |
1.000 1.000 | 1.000 |
||||||||
| Plot | Lyso | Other | |||||||||||
| Expt D |
1 peptide |
2 spectra |
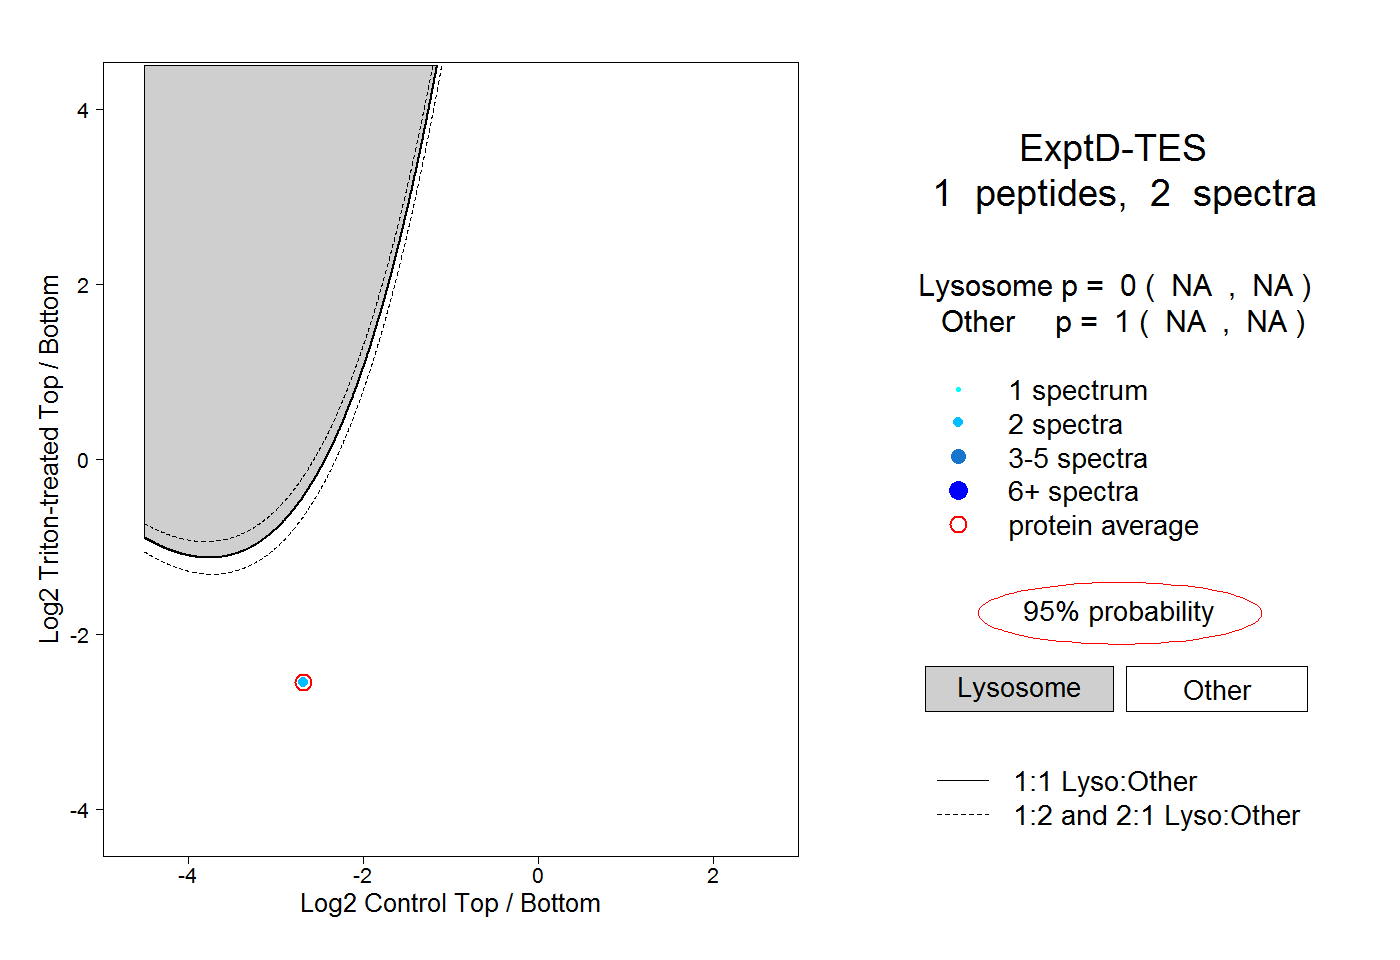 |
0.000 NA | NA |
1.000 NA | NA |