 4
4peptides
spectra
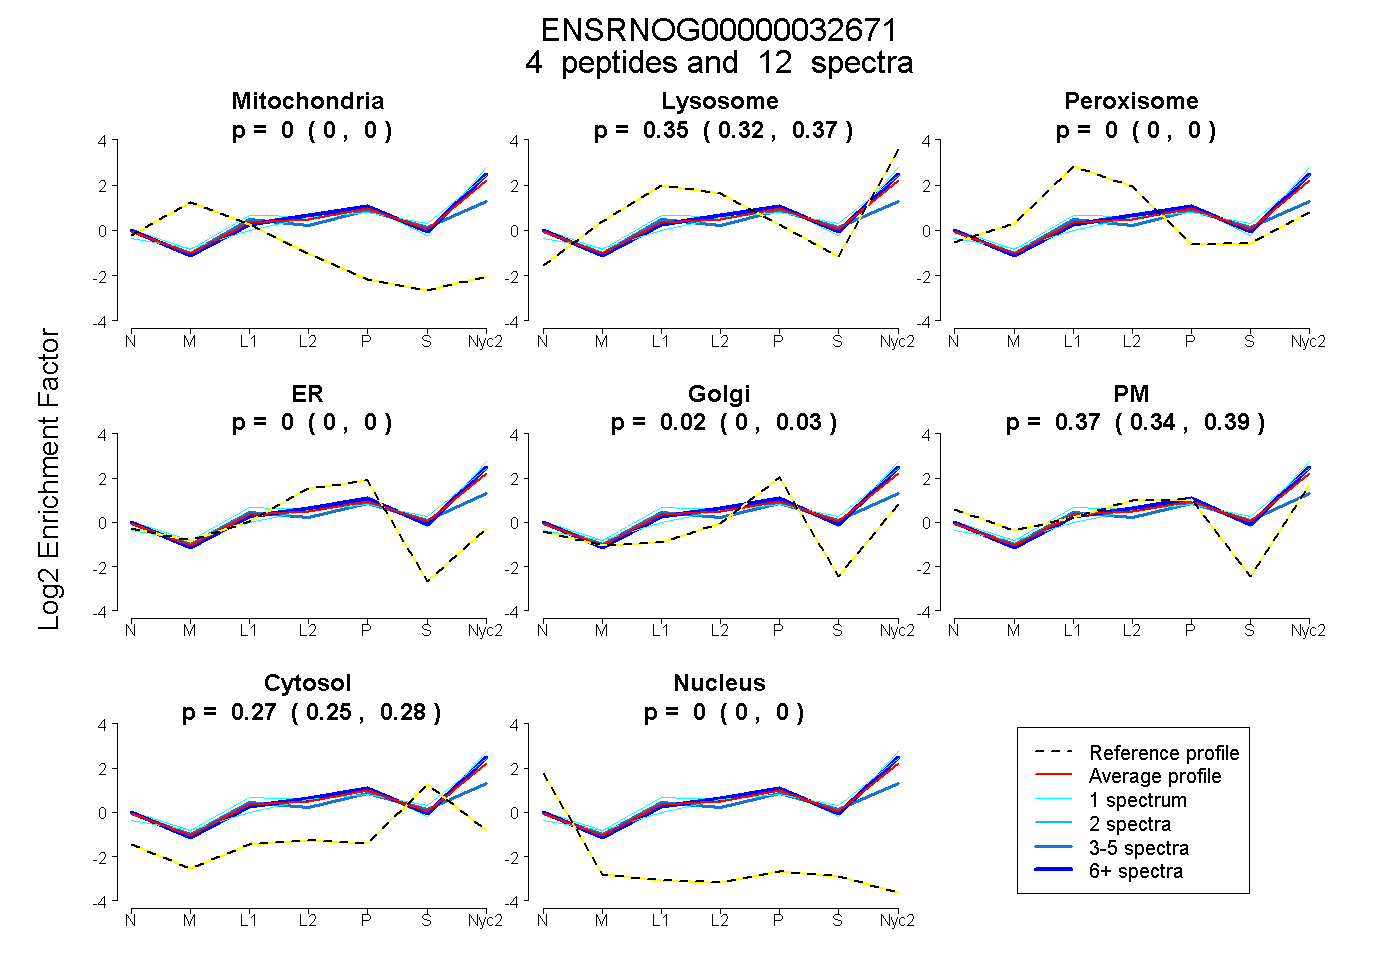
0.000 | 0.000
0.321 | 0.371
0.000 | 0.000
0.000 | 0.000
0.000 | 0.034
0.341 | 0.391
0.254 | 0.279
0.000 | 0.000
3peptides
spectra
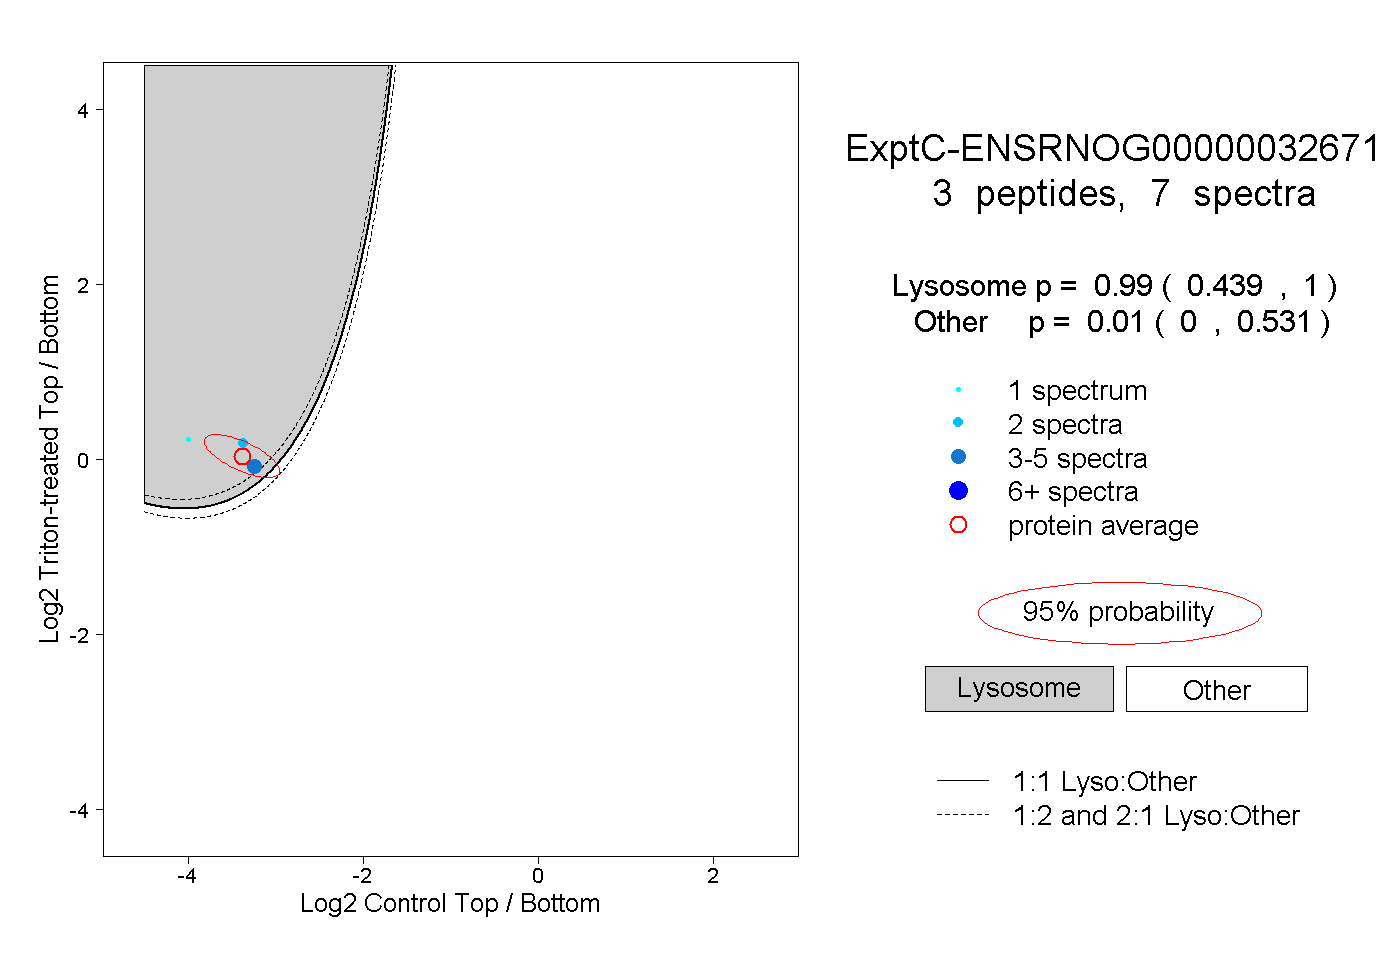
0.439 | 1.000
0.000 | 0.531
2peptides
spectra
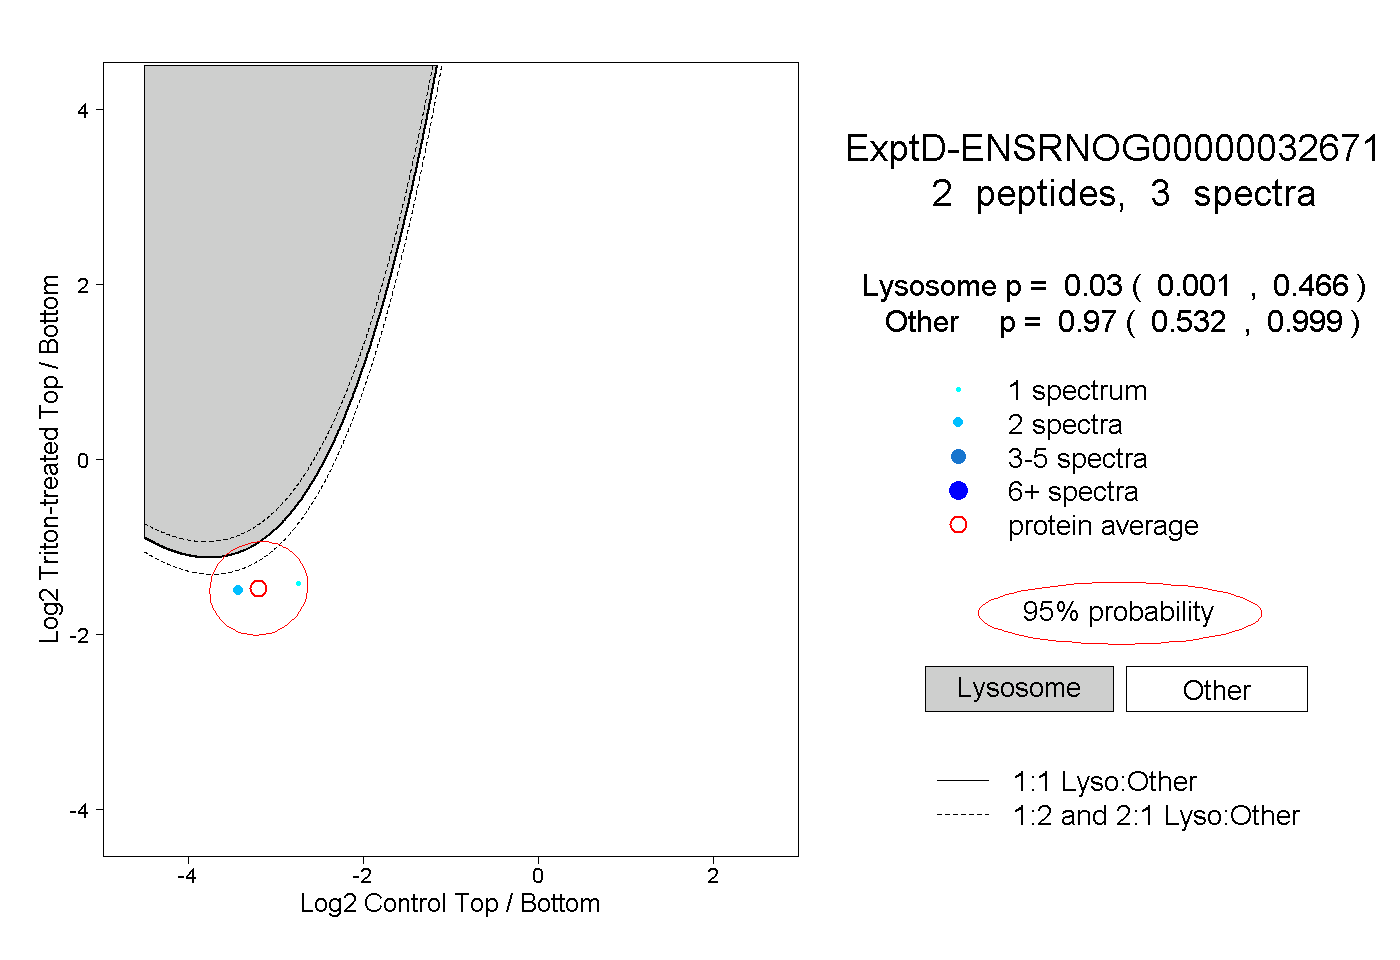
0.001 | 0.466
0.532 | 0.999