 4
4peptides
spectra
0.000 | 0.000
0.321 | 0.371
0.000 | 0.000
0.000 | 0.000
0.000 | 0.034
0.341 | 0.391
0.254 | 0.279
0.000 | 0.000
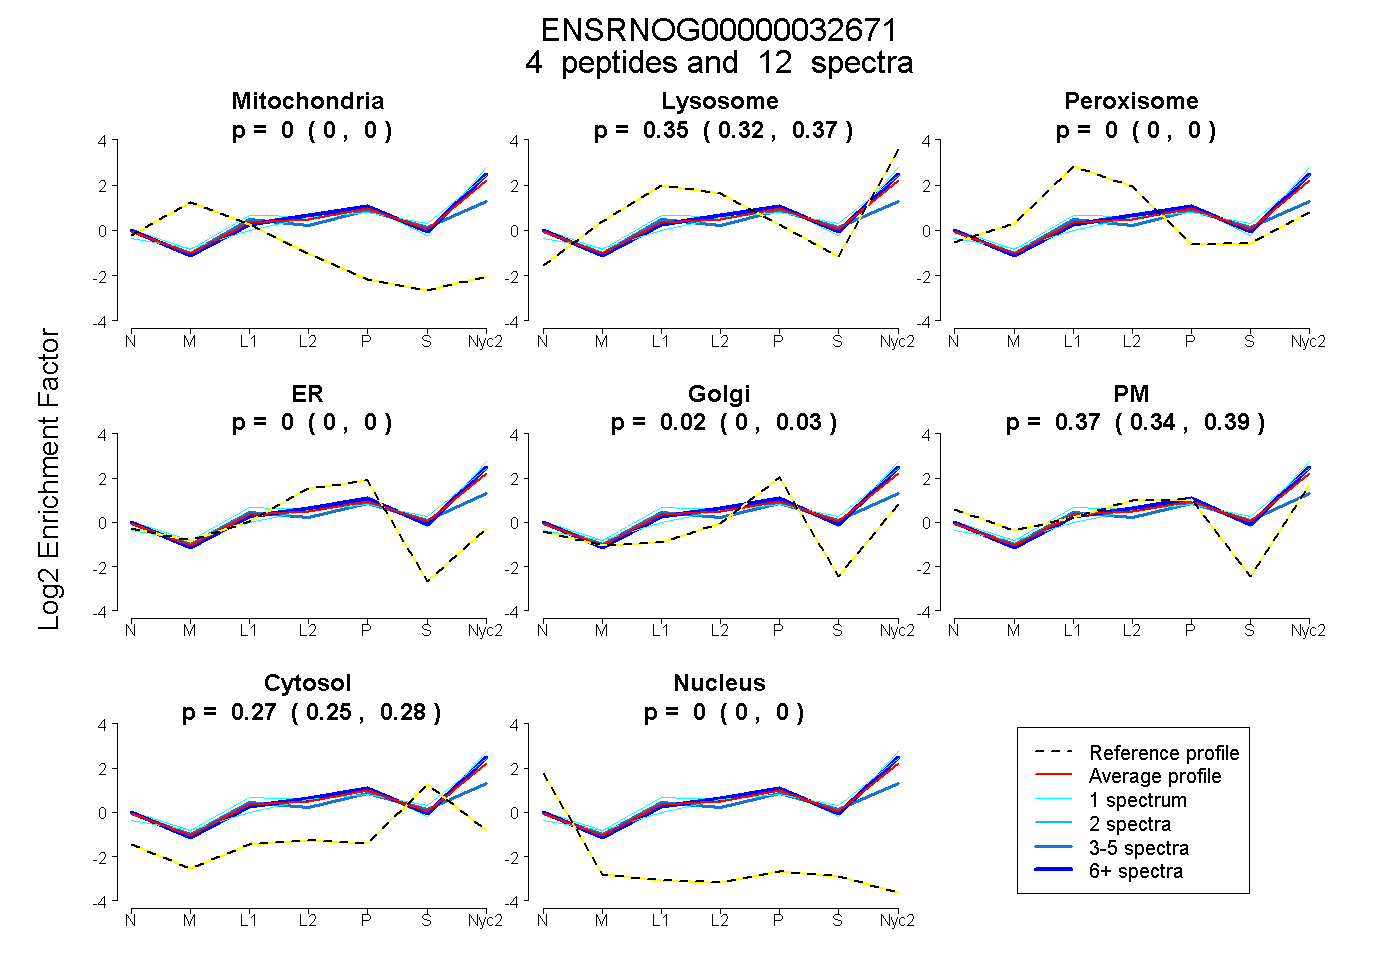
| Plot | Mito | Lyso | Perox | ER | Golgi | PM | Cytosol | Nucleus | |||||
| Expt A |
4 peptides |
12 spectra |
|
0.000 0.000 | 0.000 |
0.348 0.321 | 0.371 |
0.000 0.000 | 0.000 |
0.000 0.000 | 0.000 |
0.015 0.000 | 0.034 |
0.369 0.341 | 0.391 |
0.267 0.254 | 0.279 |
0.000 0.000 | 0.000 |
| 4 spectra, AEDTATYYCAR | 0.000 | 0.182 | 0.112 | 0.000 | 0.094 | 0.301 | 0.311 | 0.000 | ||
| 6 spectra, APEWLGFIR | 0.000 | 0.358 | 0.000 | 0.000 | 0.038 | 0.372 | 0.232 | 0.000 | ||
| 1 spectrum, LLESGGGLVQPGGSMR | 0.000 | 0.443 | 0.000 | 0.000 | 0.071 | 0.195 | 0.291 | 0.000 | ||
| 1 spectrum, ANGYTTEYNPSVK | 0.000 | 0.432 | 0.000 | 0.000 | 0.000 | 0.388 | 0.180 | 0.000 |
| Plot | Lyso | Other | |||||||||||
| Expt C |
3 peptides |
7 spectra |
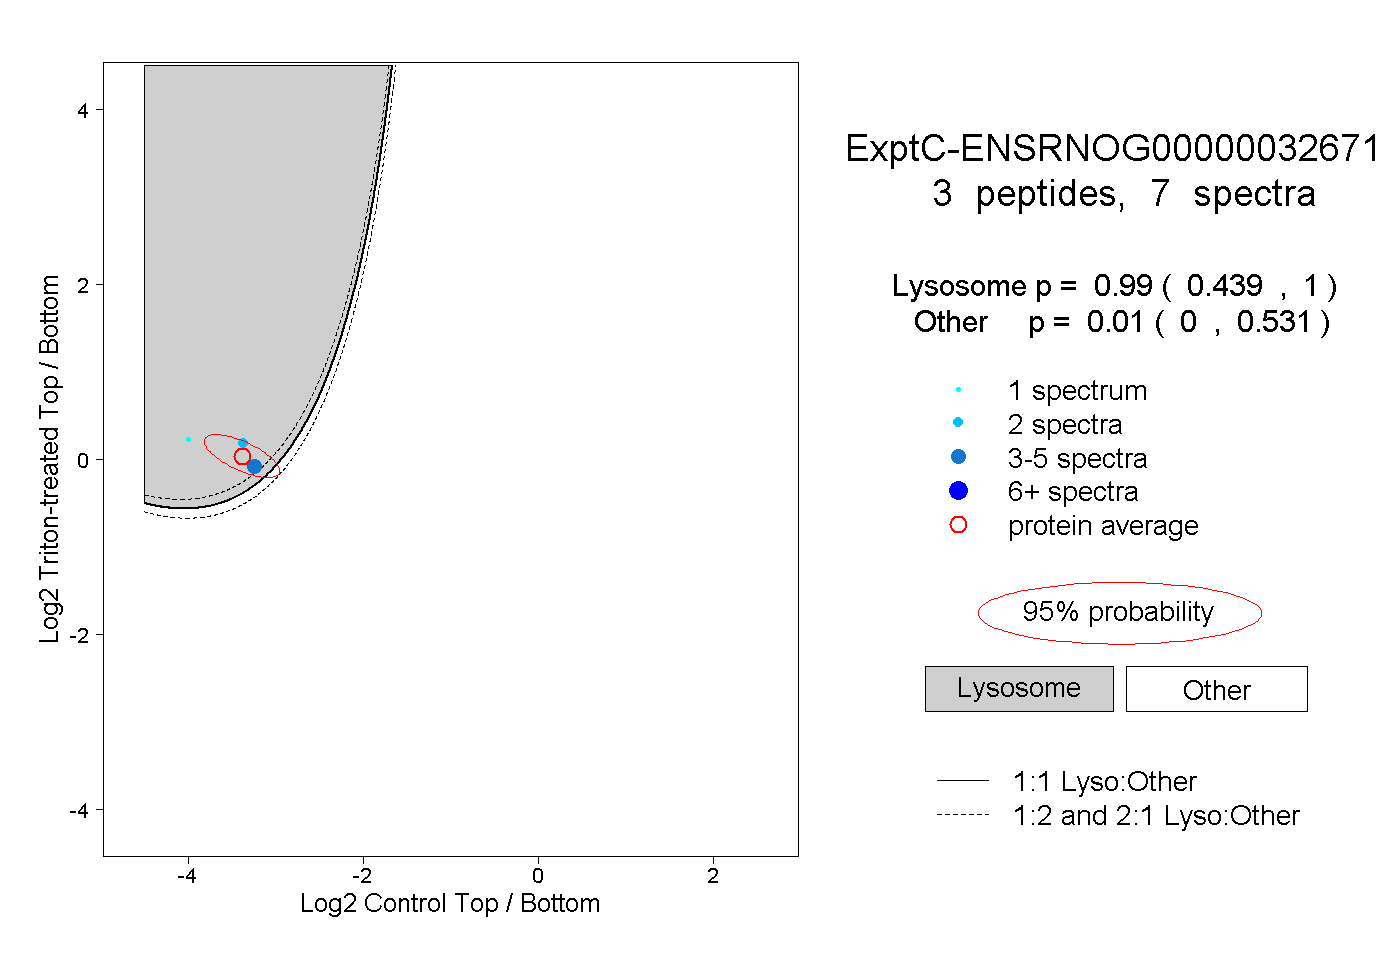 |
0.990 0.439 | 1.000 |
0.010 0.000 | 0.531 |
||||||||
| Plot | Lyso | Other | |||||||||||
| Expt D |
2 peptides |
3 spectra |
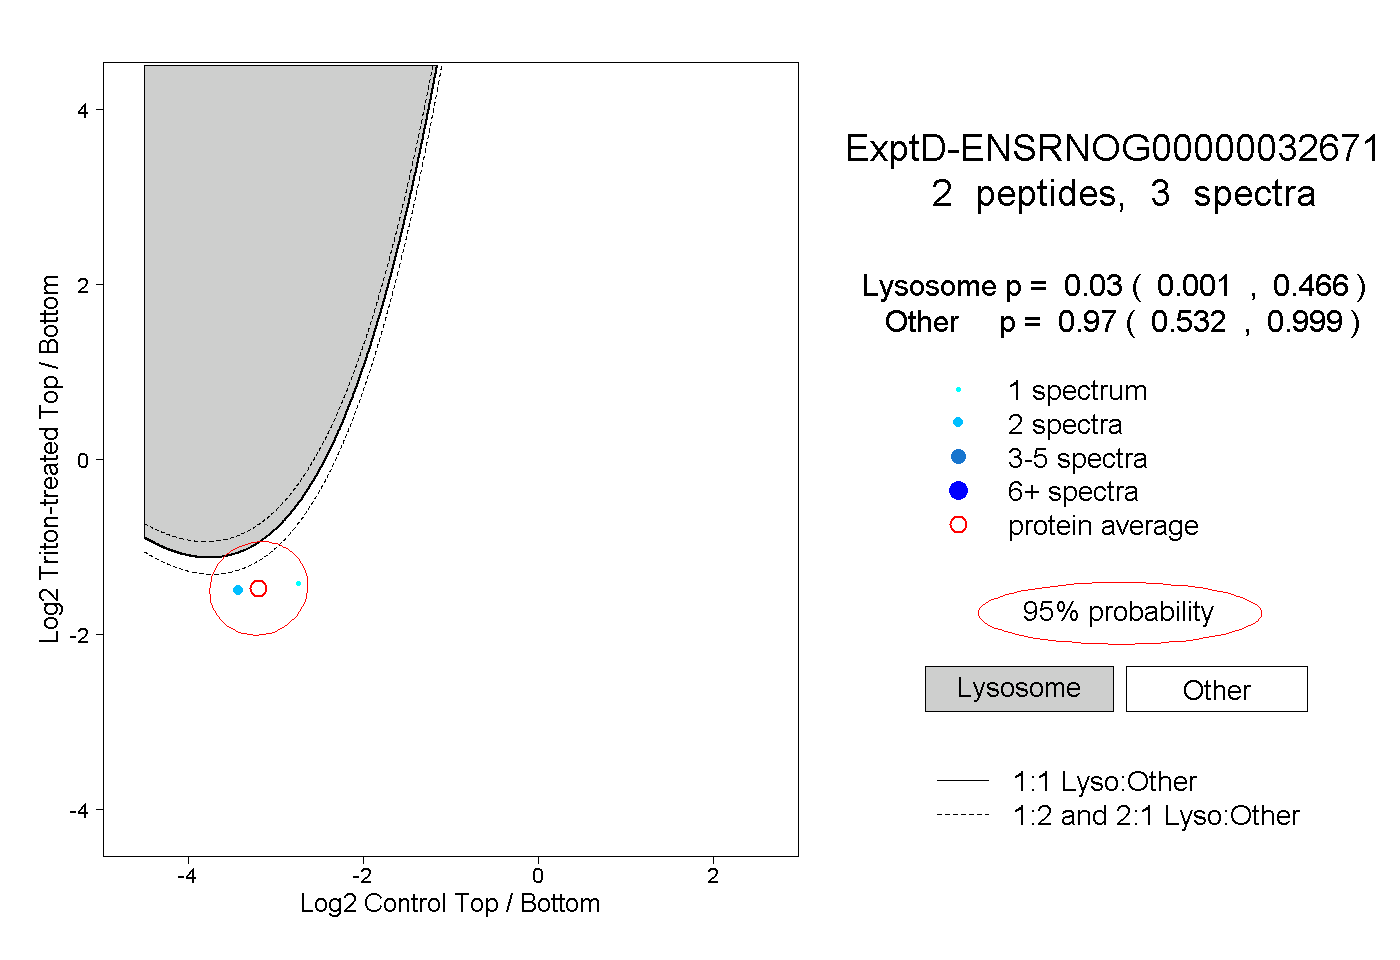 |
0.030 0.001 | 0.466 |
0.970 0.532 | 0.999 |