 10
10peptides
spectra
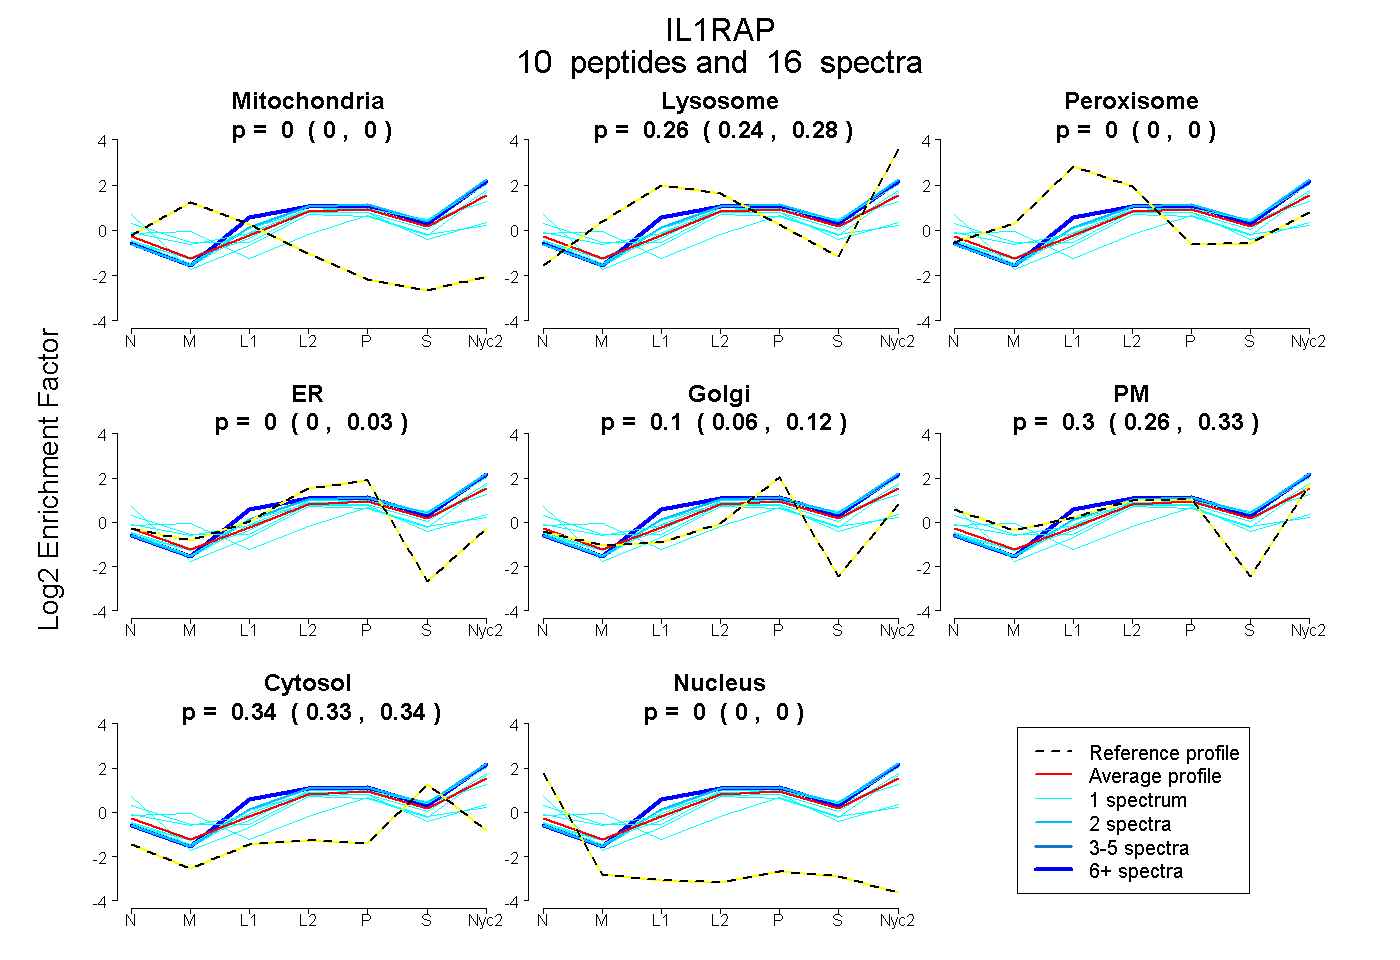
0.000 | 0.000
0.241 | 0.283
0.000 | 0.000
0.000 | 0.031
0.060 | 0.121
0.259 | 0.335
0.325 | 0.344
0.000 | 0.000
1peptide
spectrum
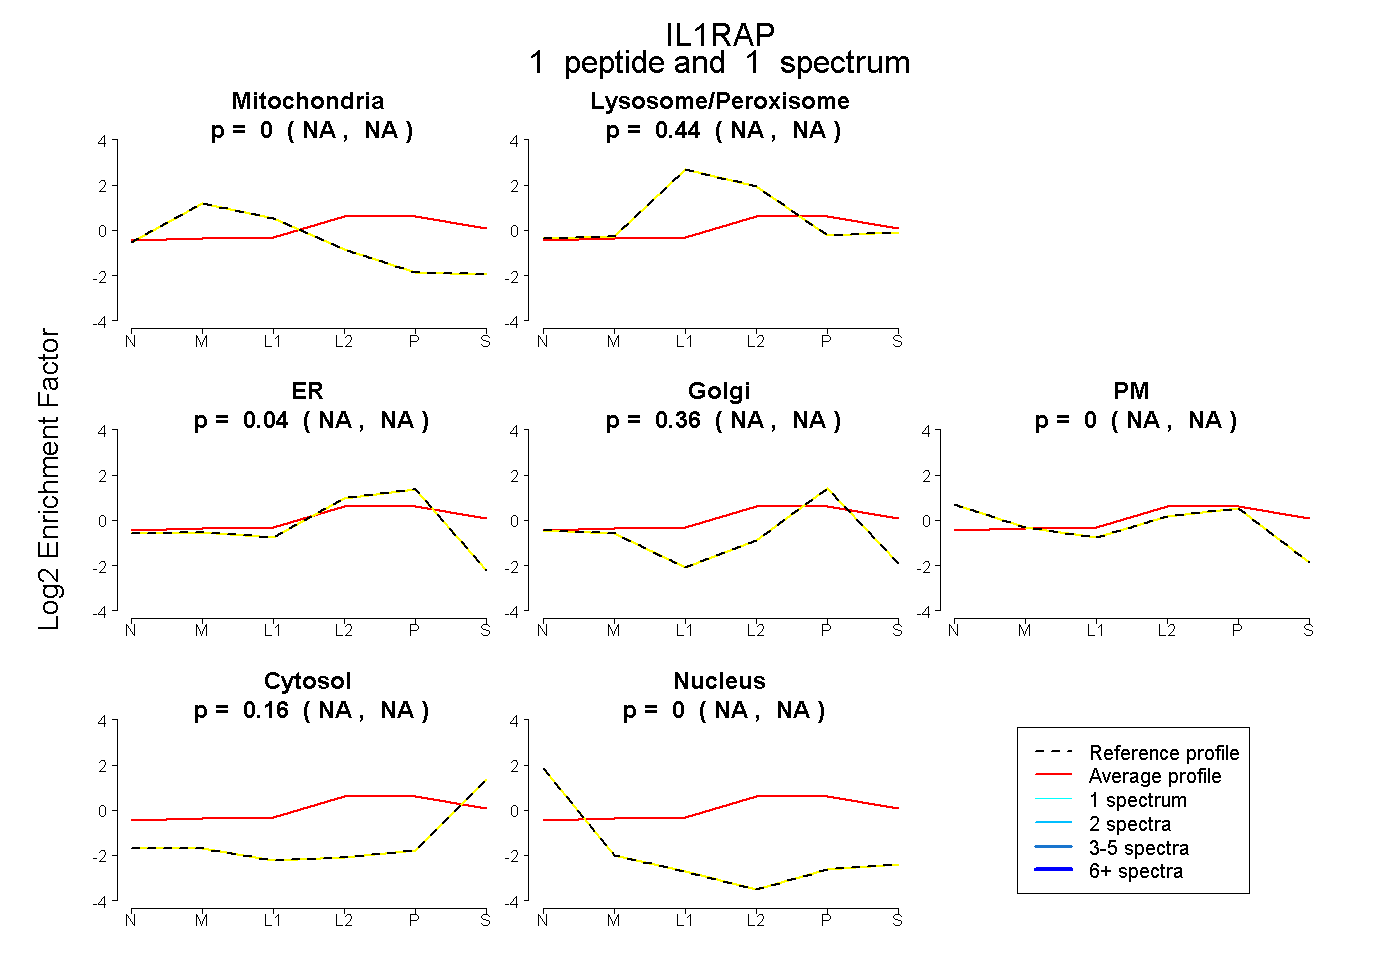
NA | NA
NA | NA
NA | NA
NA | NA
NA | NA
NA | NA
NA | NA
8peptides
spectra
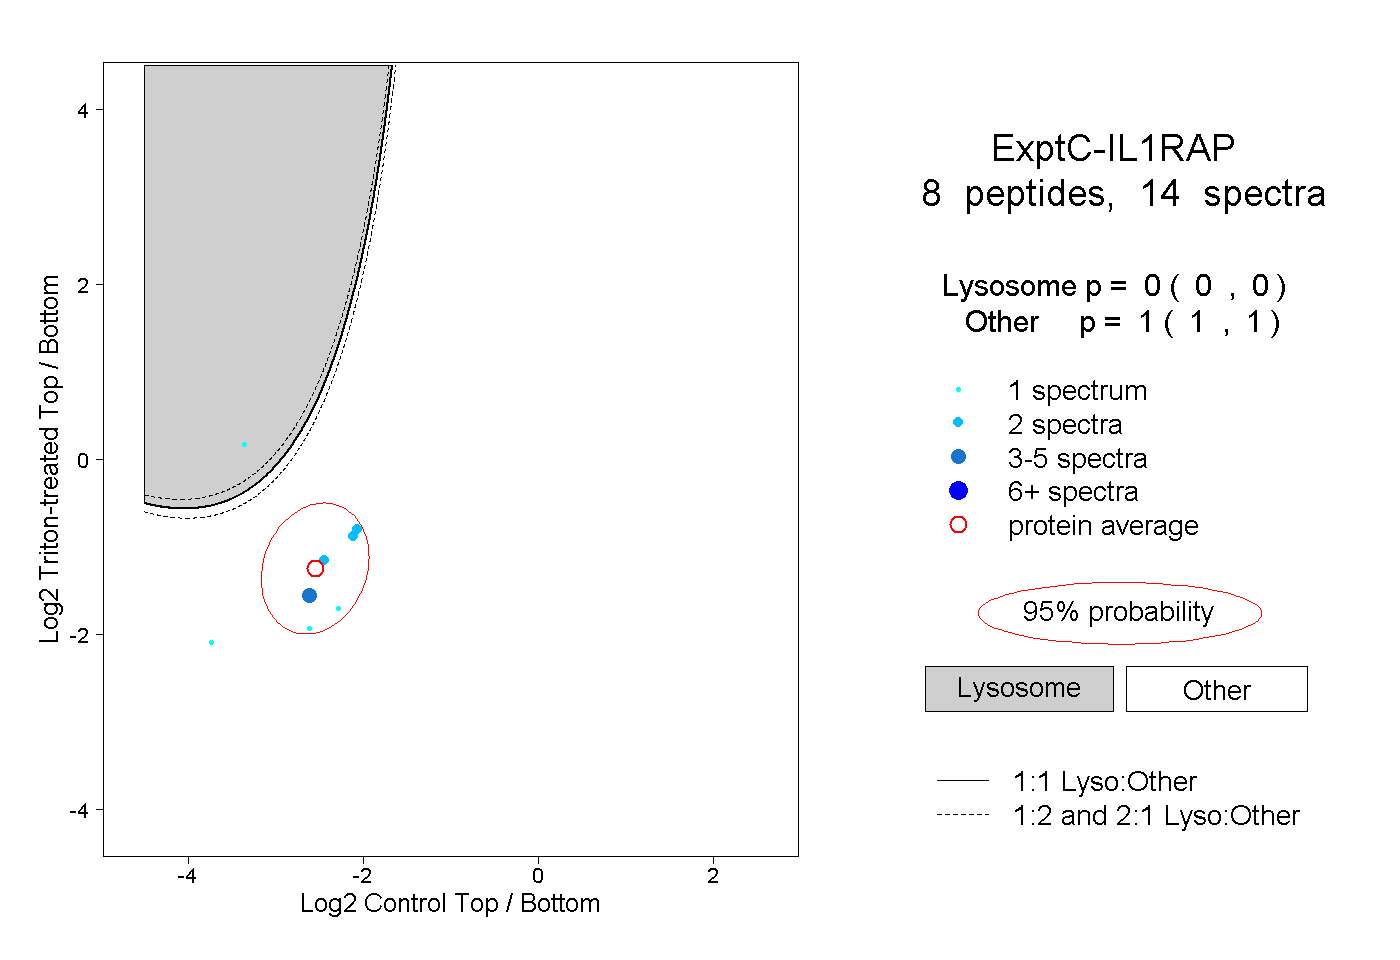
0.000 | 0.000
1.000 | 1.000
1peptide
spectra
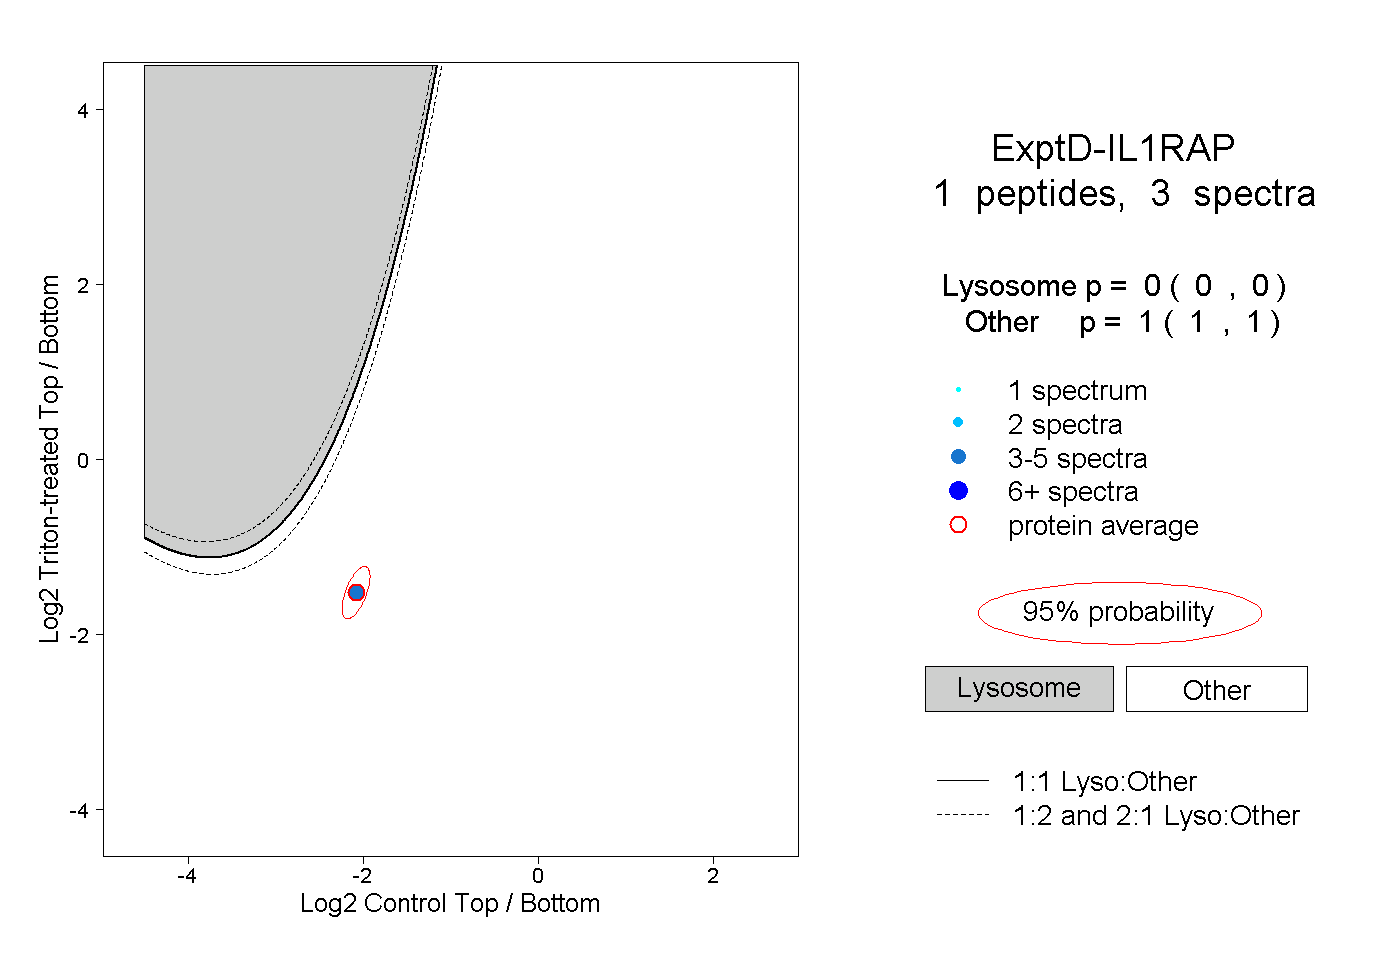
0.000 | 0.000
1.000 | 1.000