 10
10peptides
spectra
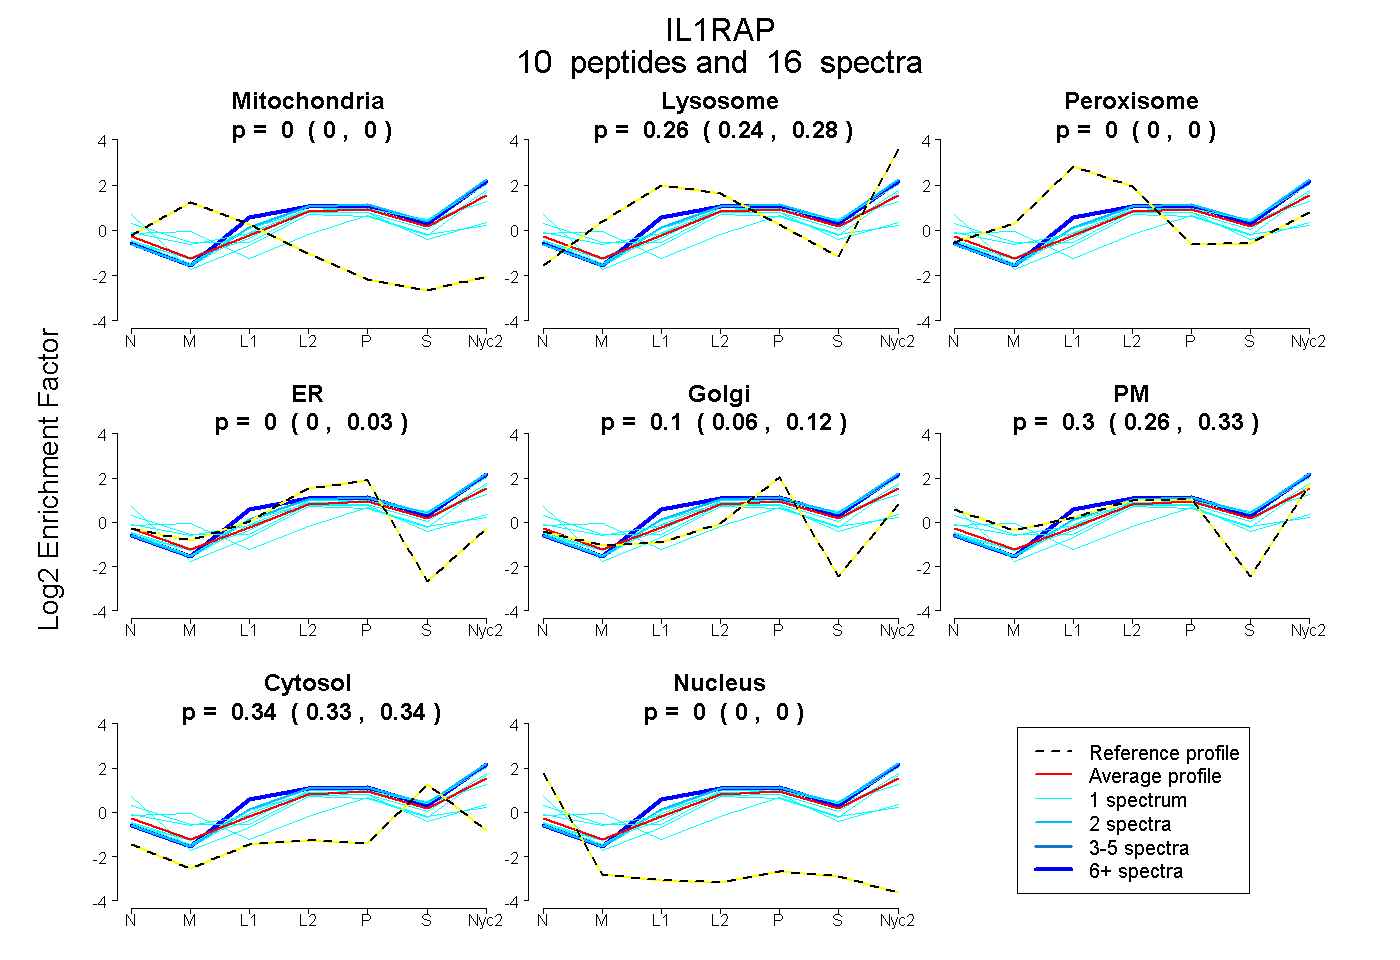
0.000 | 0.000
0.241 | 0.283
0.000 | 0.000
0.000 | 0.031
0.060 | 0.121
0.259 | 0.335
0.325 | 0.344
0.000 | 0.000
| Plot | Mito | Lyso | Perox | ER | Golgi | PM | Cytosol | Nucleus | |||||
| Expt A |
10 peptides |
16 spectra |
|
0.000 0.000 | 0.000 |
0.264 0.241 | 0.283 |
0.000 0.000 | 0.000 |
0.000 0.000 | 0.031 |
0.098 0.060 | 0.121 |
0.303 0.259 | 0.335 |
0.335 0.325 | 0.344 |
0.000 0.000 | 0.000 |
| 1 spectrum, TQILSIK | 0.000 | 0.285 | 0.000 | 0.000 | 0.000 | 0.422 | 0.293 | 0.000 | ||
| 1 spectrum, GCTEIVNFHNVQPK | 0.000 | 0.352 | 0.000 | 0.205 | 0.000 | 0.082 | 0.361 | 0.000 | ||
| 1 spectrum, NAEEEEFVLLTLR | 0.000 | 0.000 | 0.071 | 0.189 | 0.000 | 0.438 | 0.302 | 0.000 | ||
| 1 spectrum, EPGEELVIPCK | 0.074 | 0.002 | 0.001 | 0.000 | 0.264 | 0.300 | 0.360 | 0.000 | ||
| 1 spectrum, CDDWGLDTMR | 0.000 | 0.299 | 0.000 | 0.064 | 0.138 | 0.167 | 0.332 | 0.000 | ||
| 1 spectrum, VAFPLEVVQK | 0.000 | 0.411 | 0.000 | 0.000 | 0.129 | 0.134 | 0.326 | 0.000 | ||
| 6 spectra, LFHLTR | 0.000 | 0.496 | 0.000 | 0.008 | 0.130 | 0.088 | 0.278 | 0.000 | ||
| 1 spectrum, NAEGEAEQAAK | 0.000 | 0.003 | 0.000 | 0.000 | 0.000 | 0.665 | 0.332 | 0.000 | ||
| 2 spectra, QIQVFEDEPAR | 0.000 | 0.470 | 0.000 | 0.000 | 0.199 | 0.043 | 0.289 | 0.000 | ||
| 1 spectrum, DLEEPINFR | 0.000 | 0.409 | 0.000 | 0.000 | 0.158 | 0.089 | 0.344 | 0.000 |
| Plot | Mito | Lyso or Perox | ER | Golgi | PM | Cytosol | Nucleus | ||||||
| Expt B |
1 peptide |
1 spectrum |
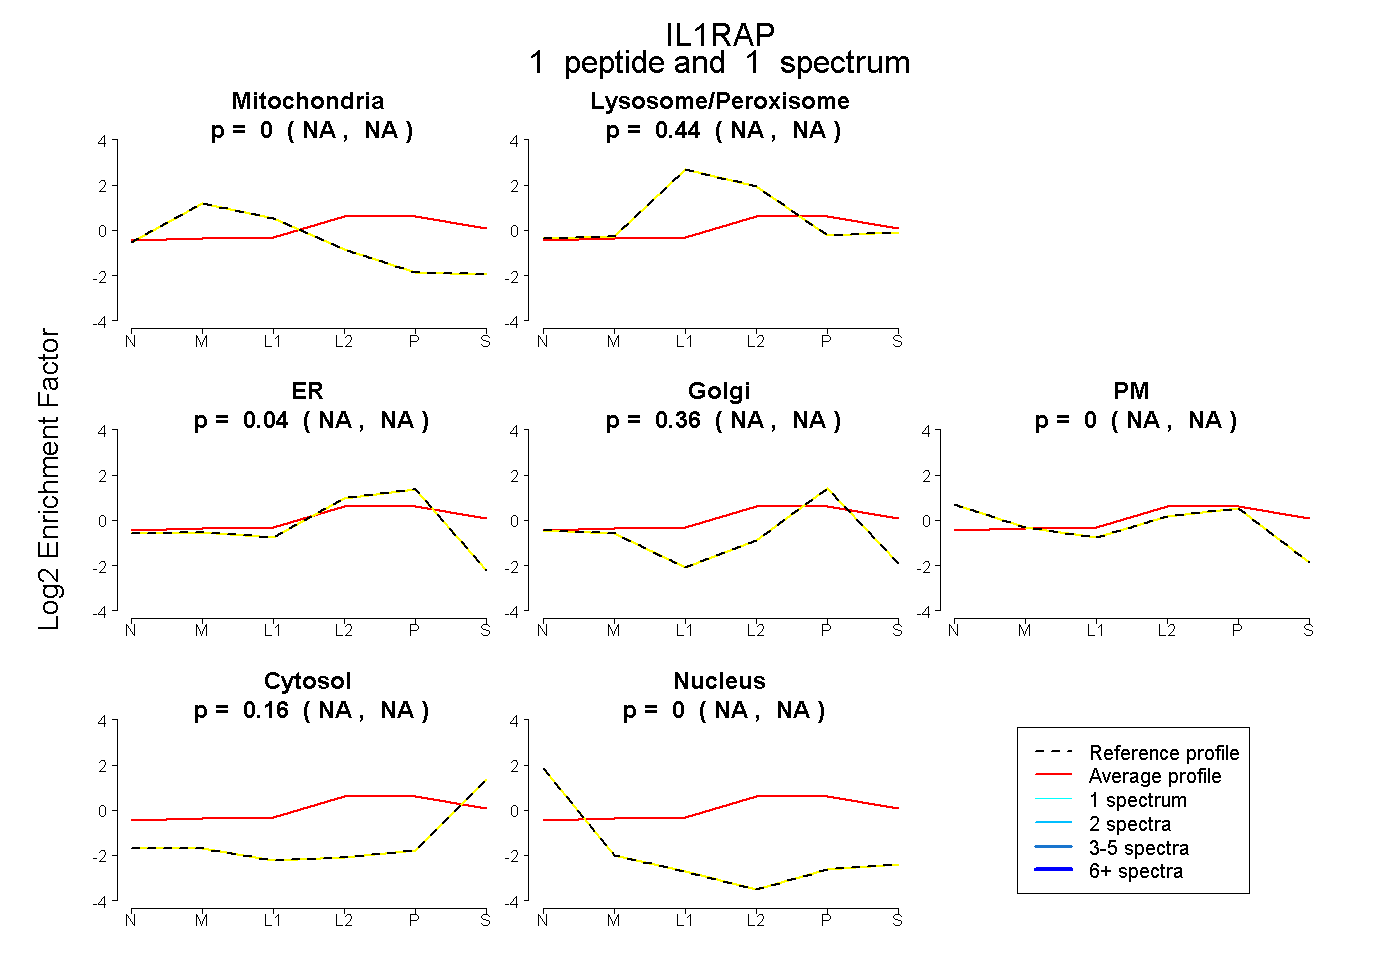 |
0.000 NA | NA |
0.437 NA | NA |
0.044 NA | NA |
0.356 NA | NA |
0.000 NA | NA |
0.163 NA | NA |
0.000 NA | NA |
|||
| Plot | Lyso | Other | |||||||||||
| Expt C |
8 peptides |
14 spectra |
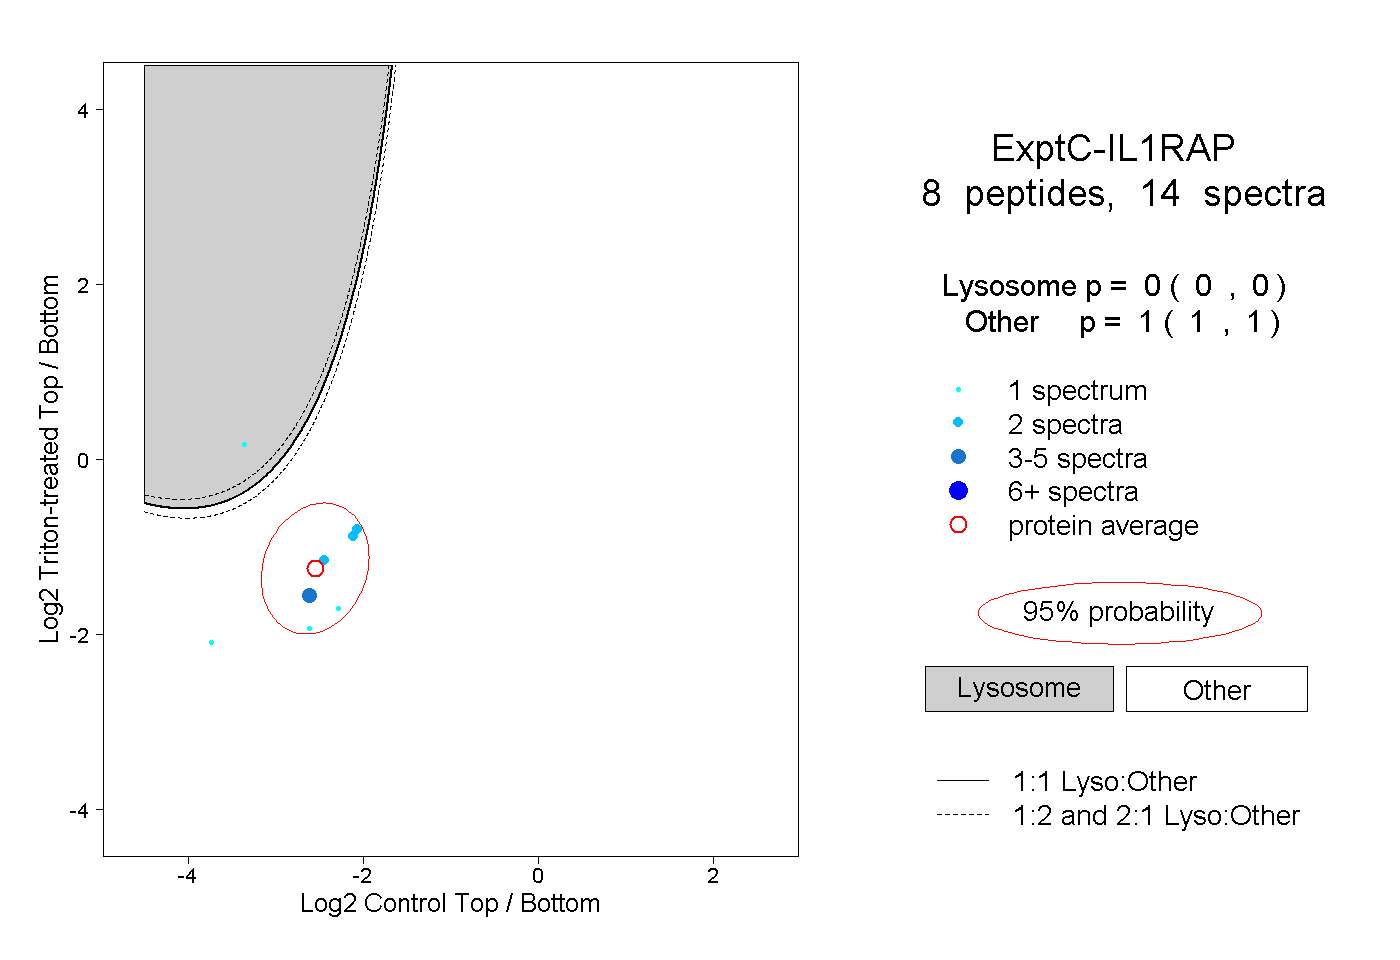 |
0.000 0.000 | 0.000 |
1.000 1.000 | 1.000 |
||||||||
| Plot | Lyso | Other | |||||||||||
| Expt D |
1 peptide |
3 spectra |
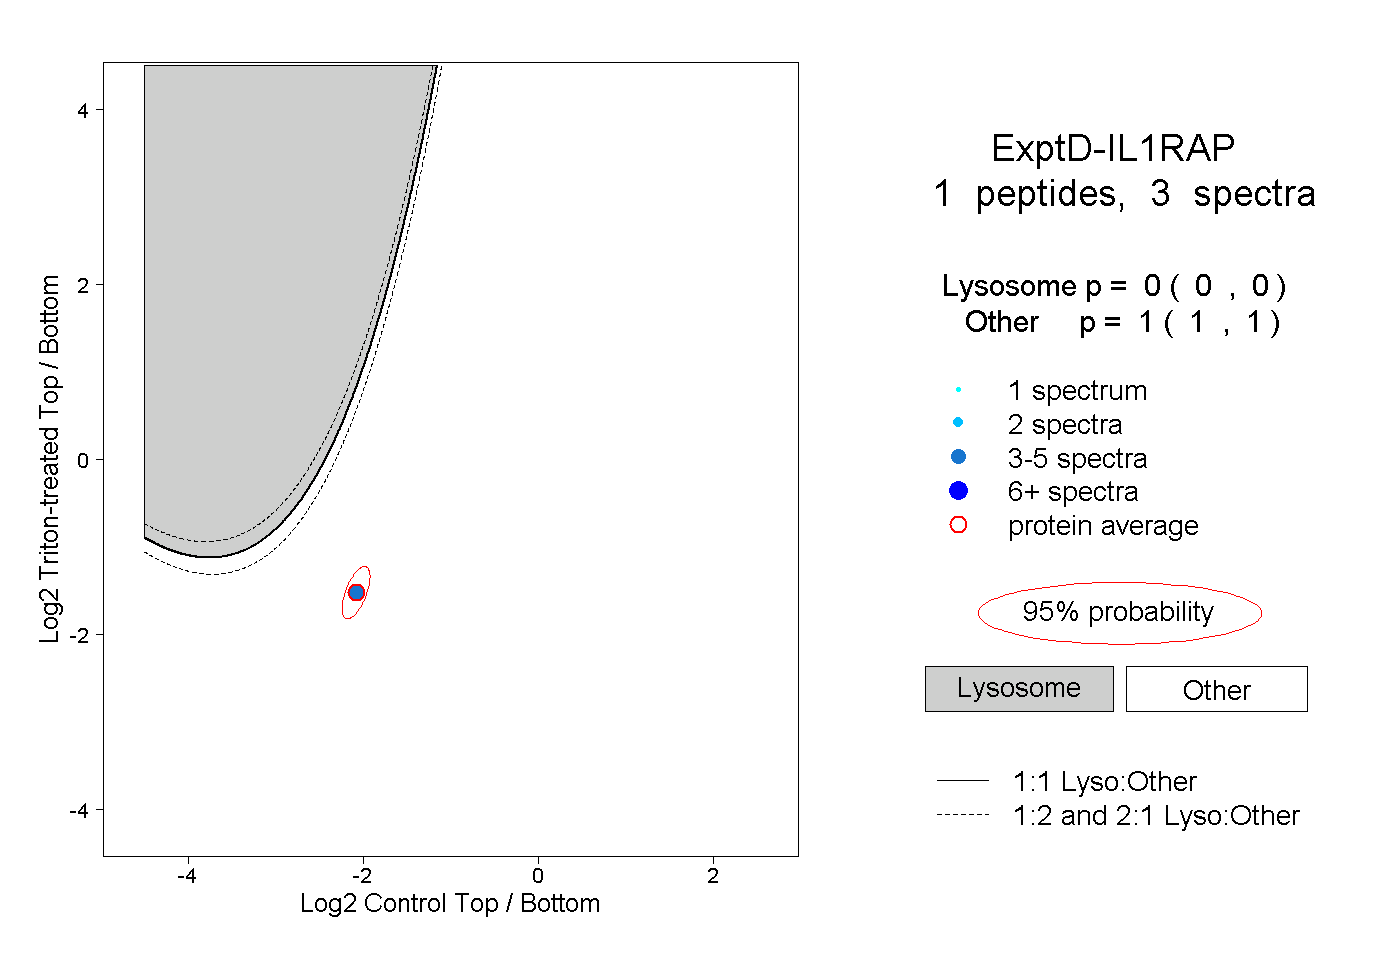 |
0.000 0.000 | 0.000 |
1.000 1.000 | 1.000 |