 5
5peptides
spectra
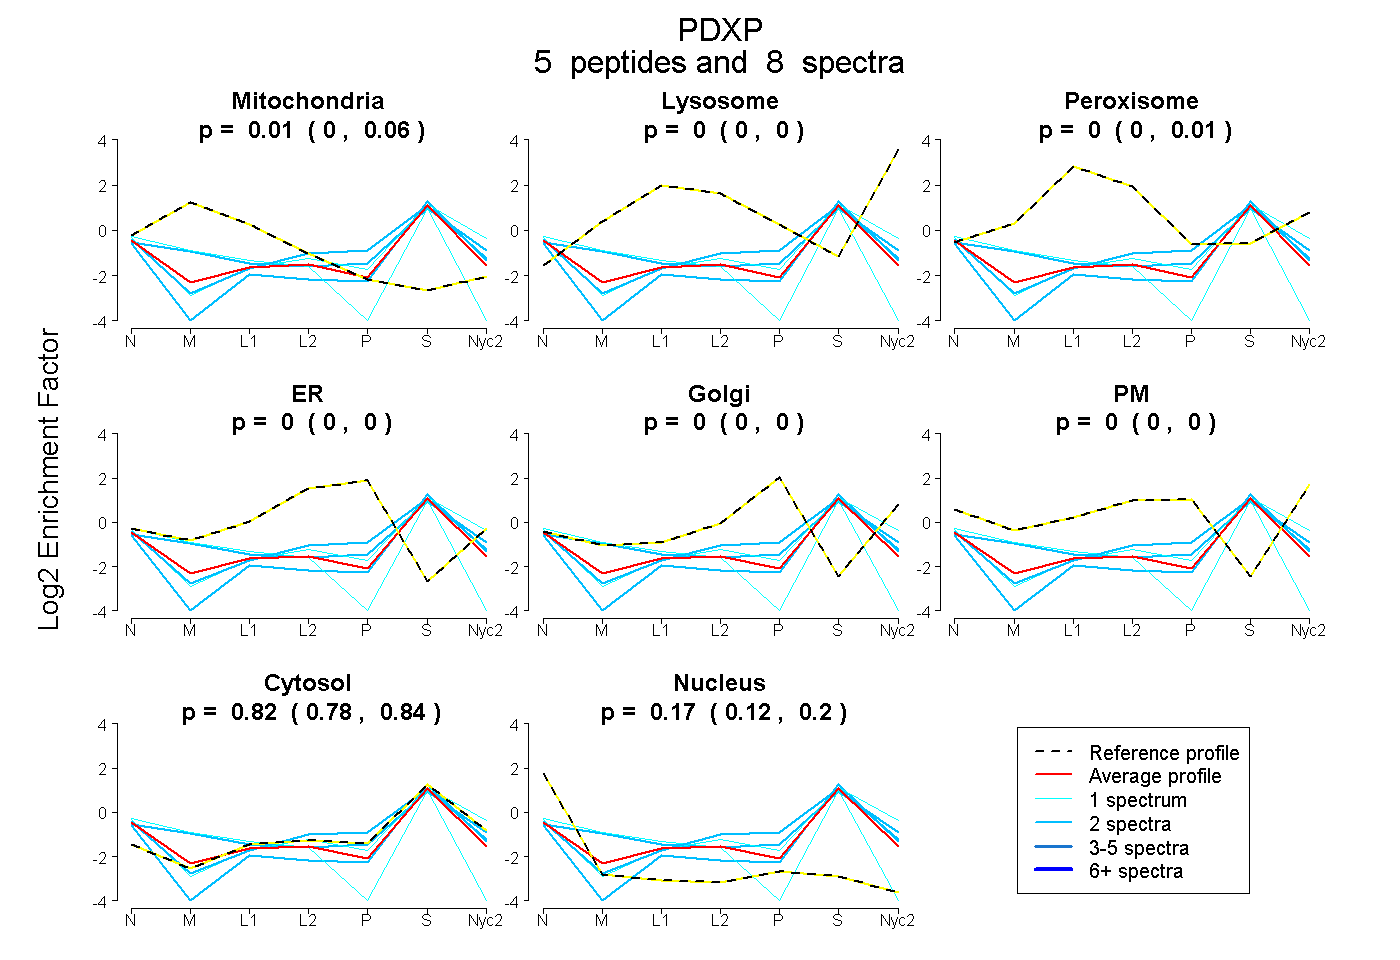
0.000 | 0.060
0.000 | 0.000
0.000 | 0.006
0.000 | 0.000
0.000 | 0.000
0.000 | 0.000
0.779 | 0.844
0.123 | 0.197
2peptides
spectra
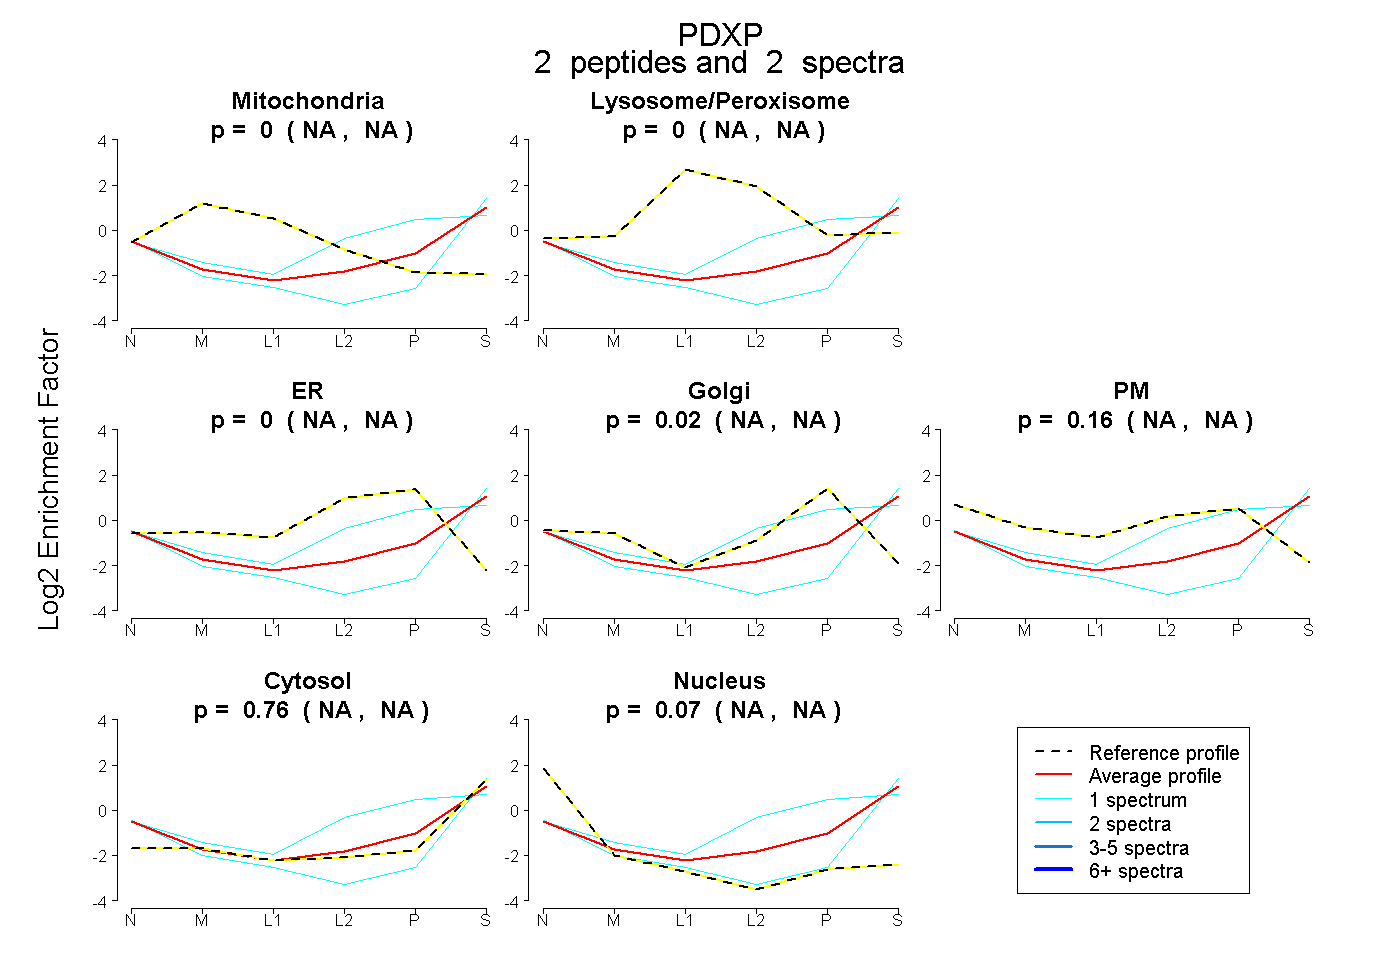
NA | NA
NA | NA
NA | NA
NA | NA
NA | NA
NA | NA
NA | NA
2peptides
spectra
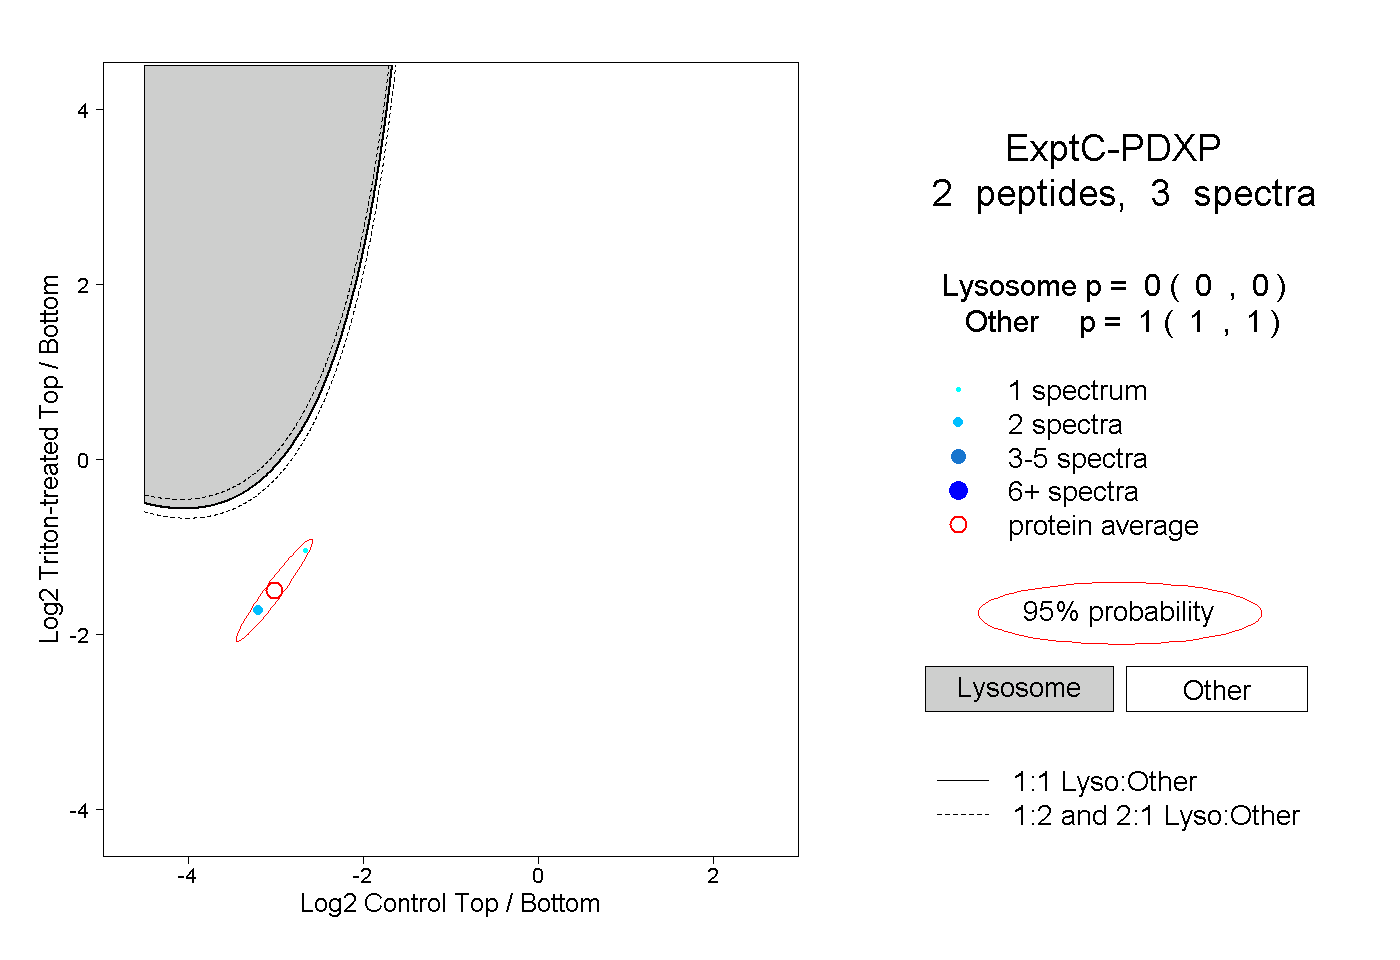
0.000 | 0.000
1.000 | 1.000