 5
5peptides
spectra
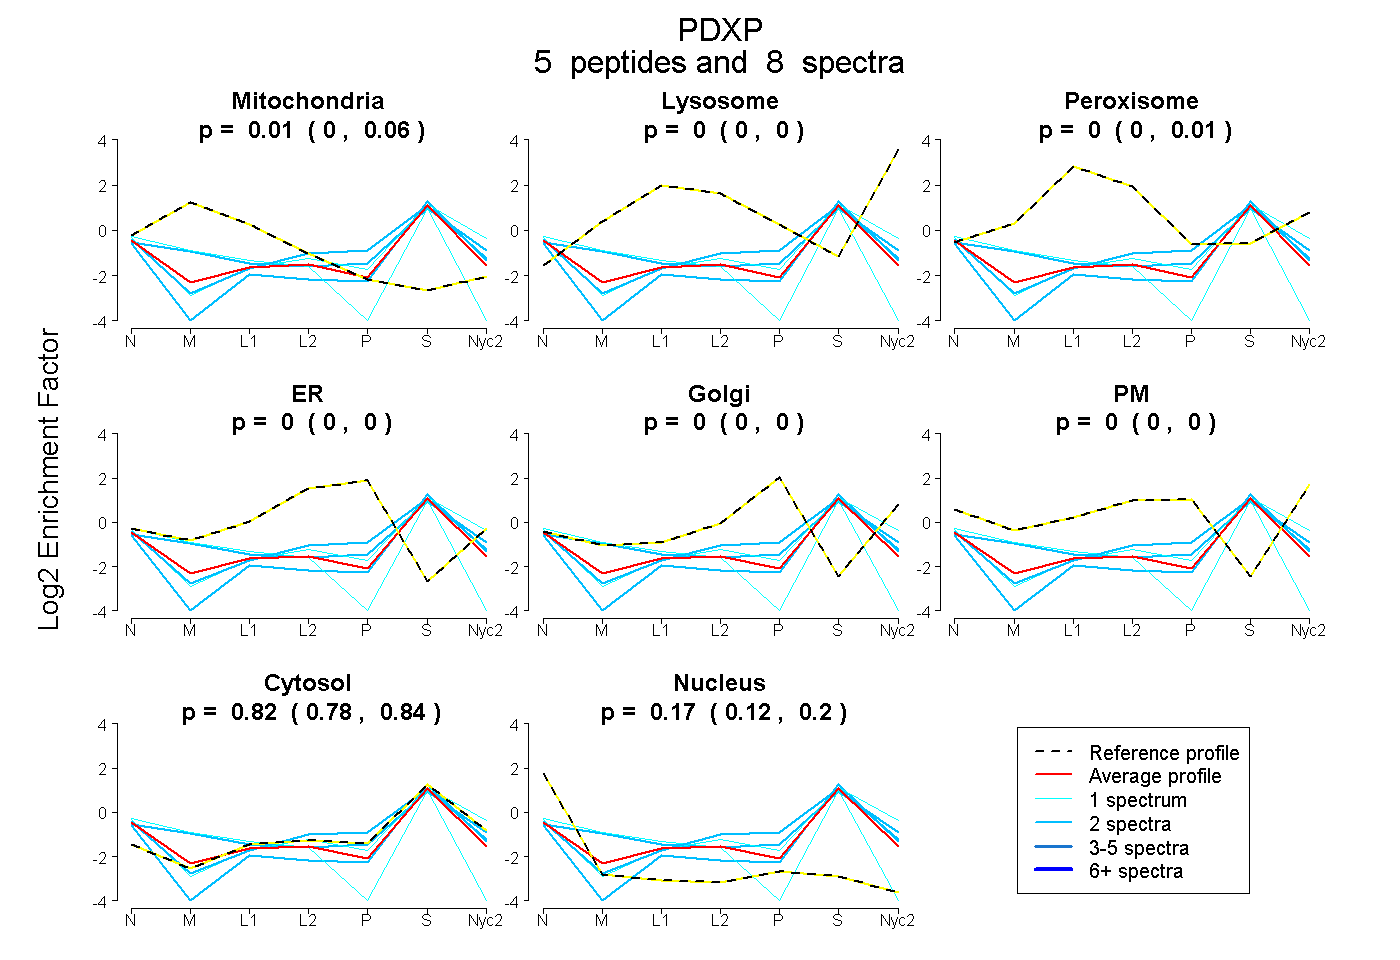
0.000 | 0.060
0.000 | 0.000
0.000 | 0.006
0.000 | 0.000
0.000 | 0.000
0.000 | 0.000
0.779 | 0.844
0.123 | 0.197
| Plot | Mito | Lyso | Perox | ER | Golgi | PM | Cytosol | Nucleus | |||||
| Expt A |
5 peptides |
8 spectra |
|
0.009 0.000 | 0.060 |
0.000 0.000 | 0.000 |
0.000 0.000 | 0.006 |
0.000 0.000 | 0.000 |
0.000 0.000 | 0.000 |
0.000 0.000 | 0.000 |
0.822 0.779 | 0.844 |
0.168 0.123 | 0.197 |
| 2 spectra, ARPELALR | 0.230 | 0.000 | 0.000 | 0.000 | 0.000 | 0.000 | 0.770 | 0.000 | ||
| 2 spectra, ATLFVSNNSR | 0.000 | 0.000 | 0.000 | 0.000 | 0.000 | 0.000 | 0.816 | 0.184 | ||
| 2 spectra, LGFTGLR | 0.000 | 0.000 | 0.000 | 0.062 | 0.000 | 0.000 | 0.844 | 0.094 | ||
| 1 spectrum, LETDILFGHR | 0.254 | 0.000 | 0.000 | 0.000 | 0.000 | 0.000 | 0.472 | 0.274 | ||
| 1 spectrum, IVPGAPELLQR | 0.000 | 0.000 | 0.000 | 0.000 | 0.000 | 0.039 | 0.885 | 0.077 |
| Plot | Mito | Lyso or Perox | ER | Golgi | PM | Cytosol | Nucleus | ||||||
| Expt B |
2 peptides |
2 spectra |
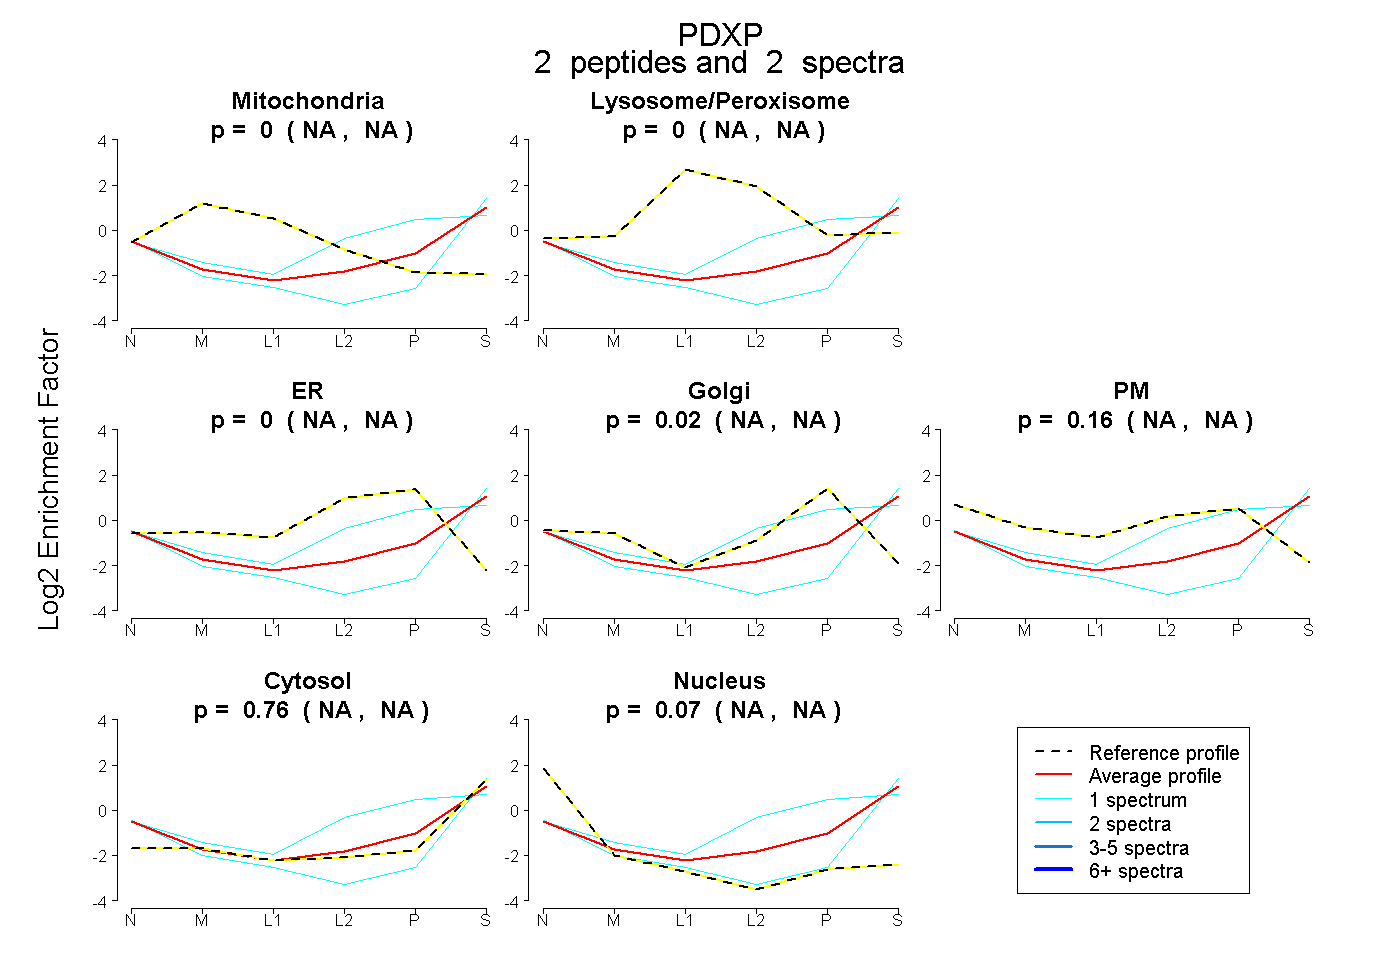 |
0.000 NA | NA |
0.000 NA | NA |
0.000 NA | NA |
0.016 NA | NA |
0.155 NA | NA |
0.756 NA | NA |
0.073 NA | NA |
|||
| Plot | Lyso | Other | |||||||||||
| Expt C |
2 peptides |
3 spectra |
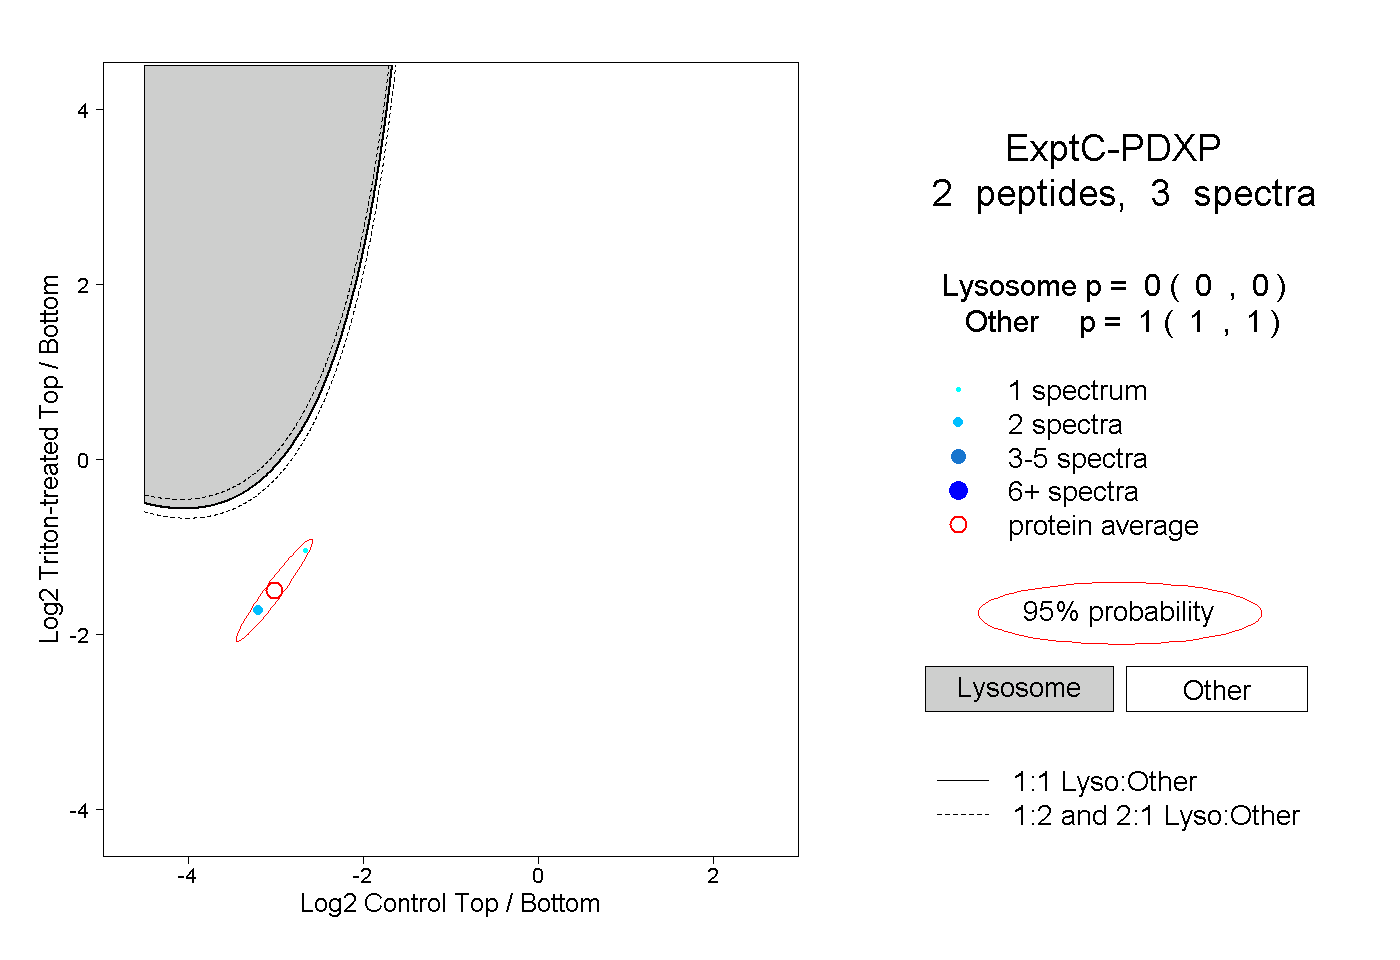 |
0.000 0.000 | 0.000 |
1.000 1.000 | 1.000 |