 10
10peptides
spectra
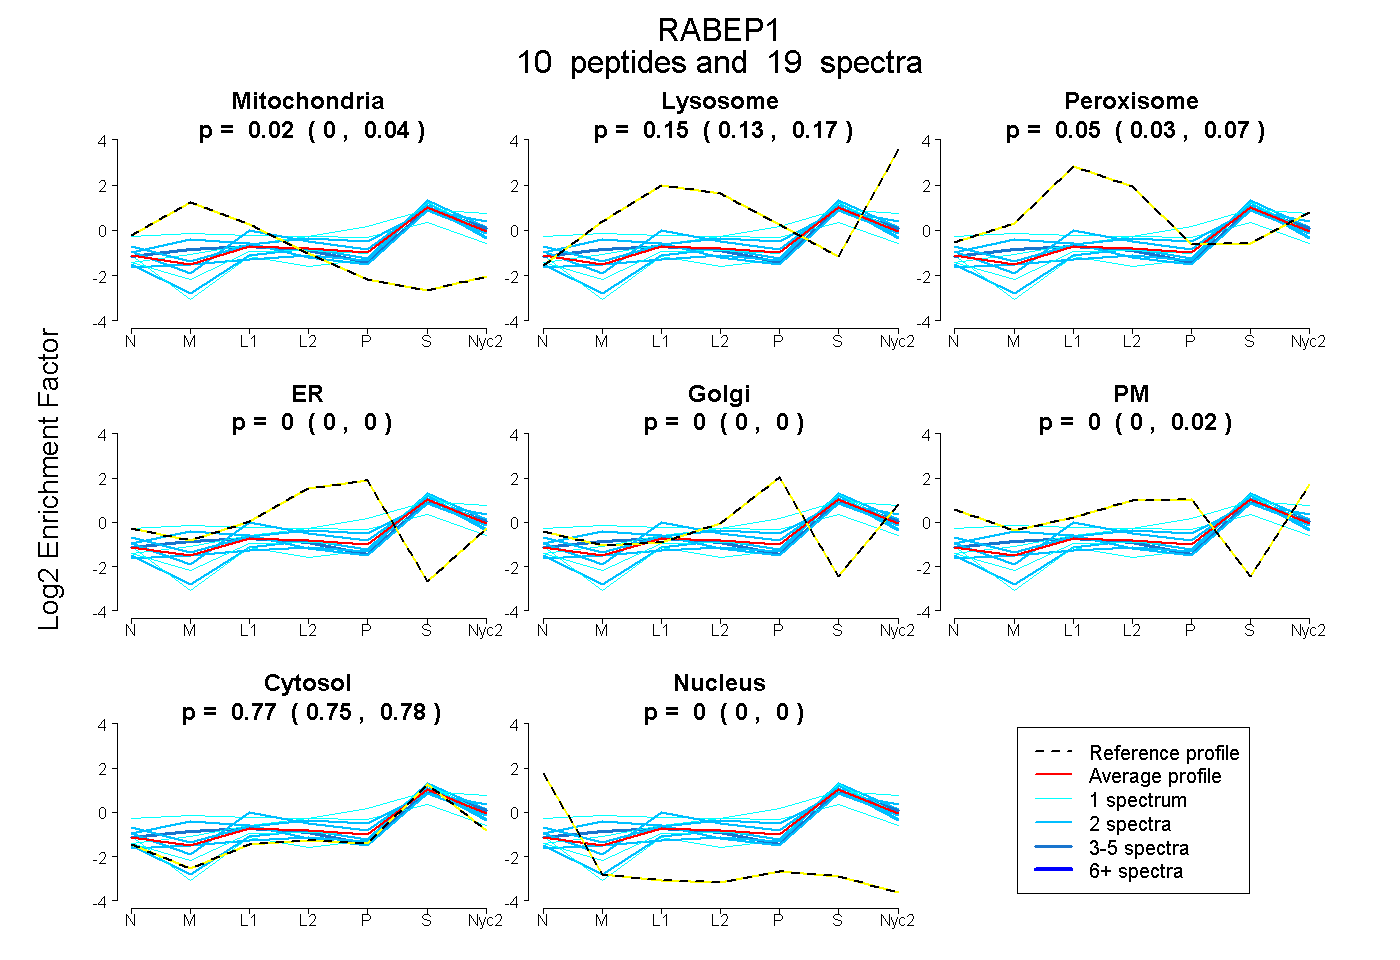
0.004 | 0.039
0.128 | 0.166
0.031 | 0.071
0.000 | 0.000
0.000 | 0.000
0.000 | 0.020
0.753 | 0.782
0.000 | 0.000
1peptide
spectrum
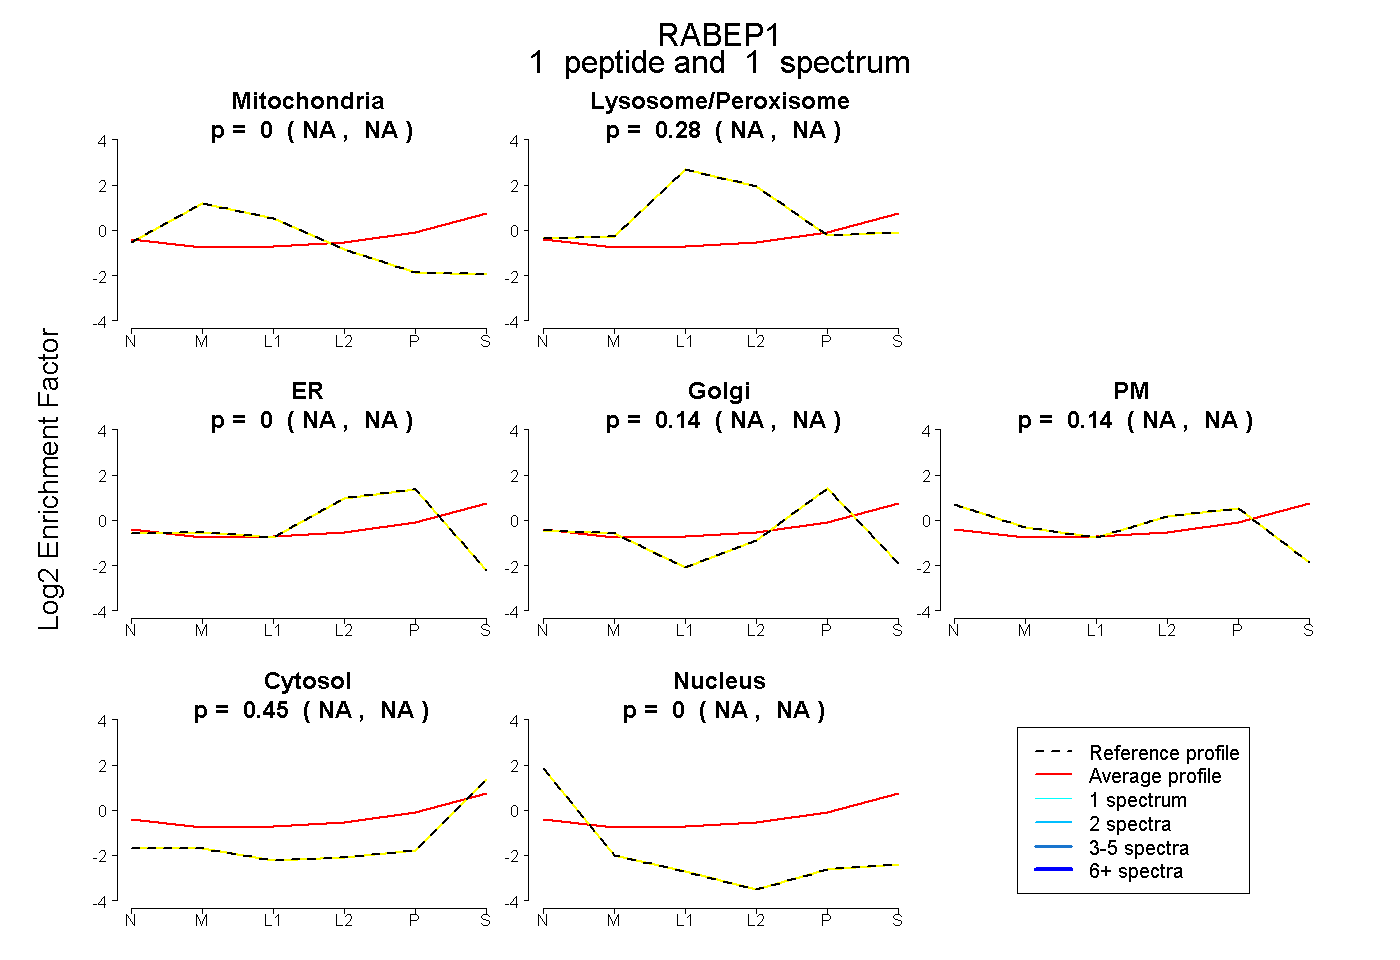
NA | NA
NA | NA
NA | NA
NA | NA
NA | NA
NA | NA
NA | NA
10peptides
spectra
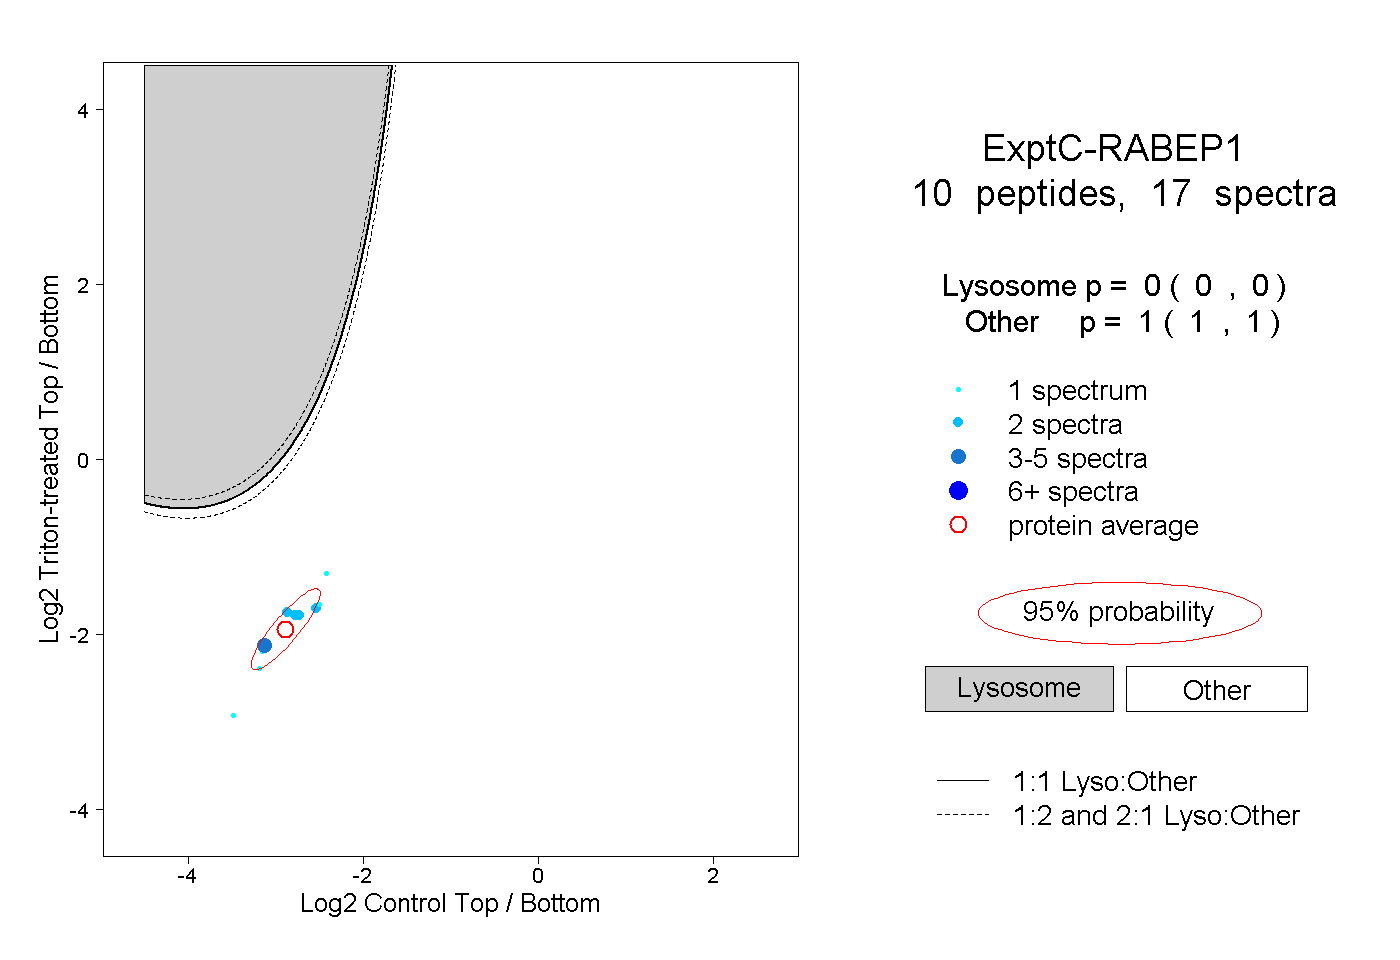
0.000 | 0.000
1.000 | 1.000