 5
5peptides
spectra
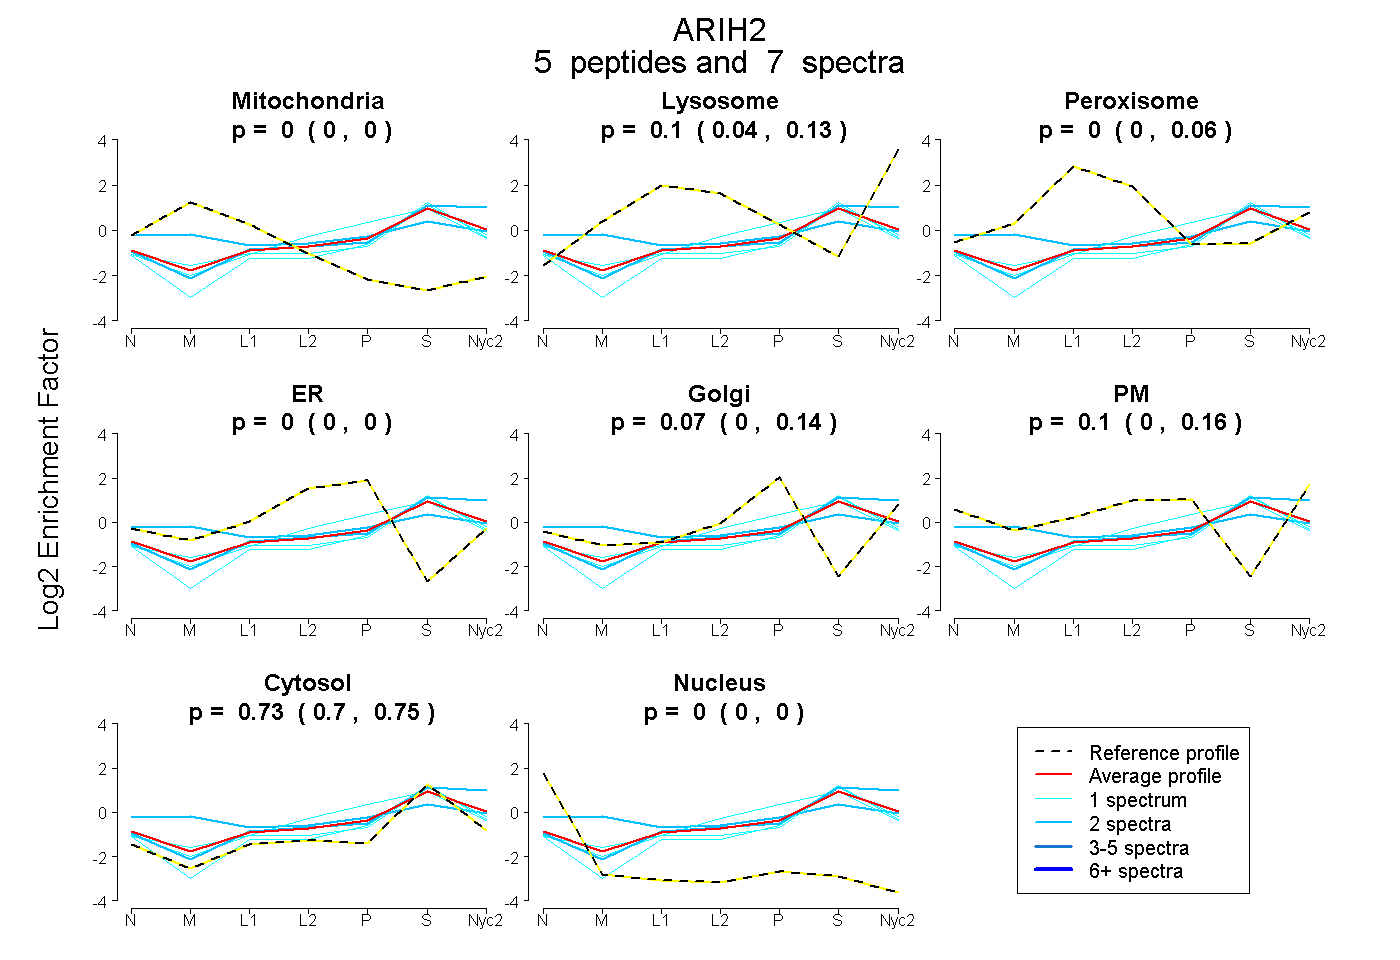
0.000 | 0.000
0.040 | 0.133
0.000 | 0.058
0.000 | 0.000
0.002 | 0.141
0.000 | 0.158
0.700 | 0.755
0.000 | 0.000
1peptide
spectrum
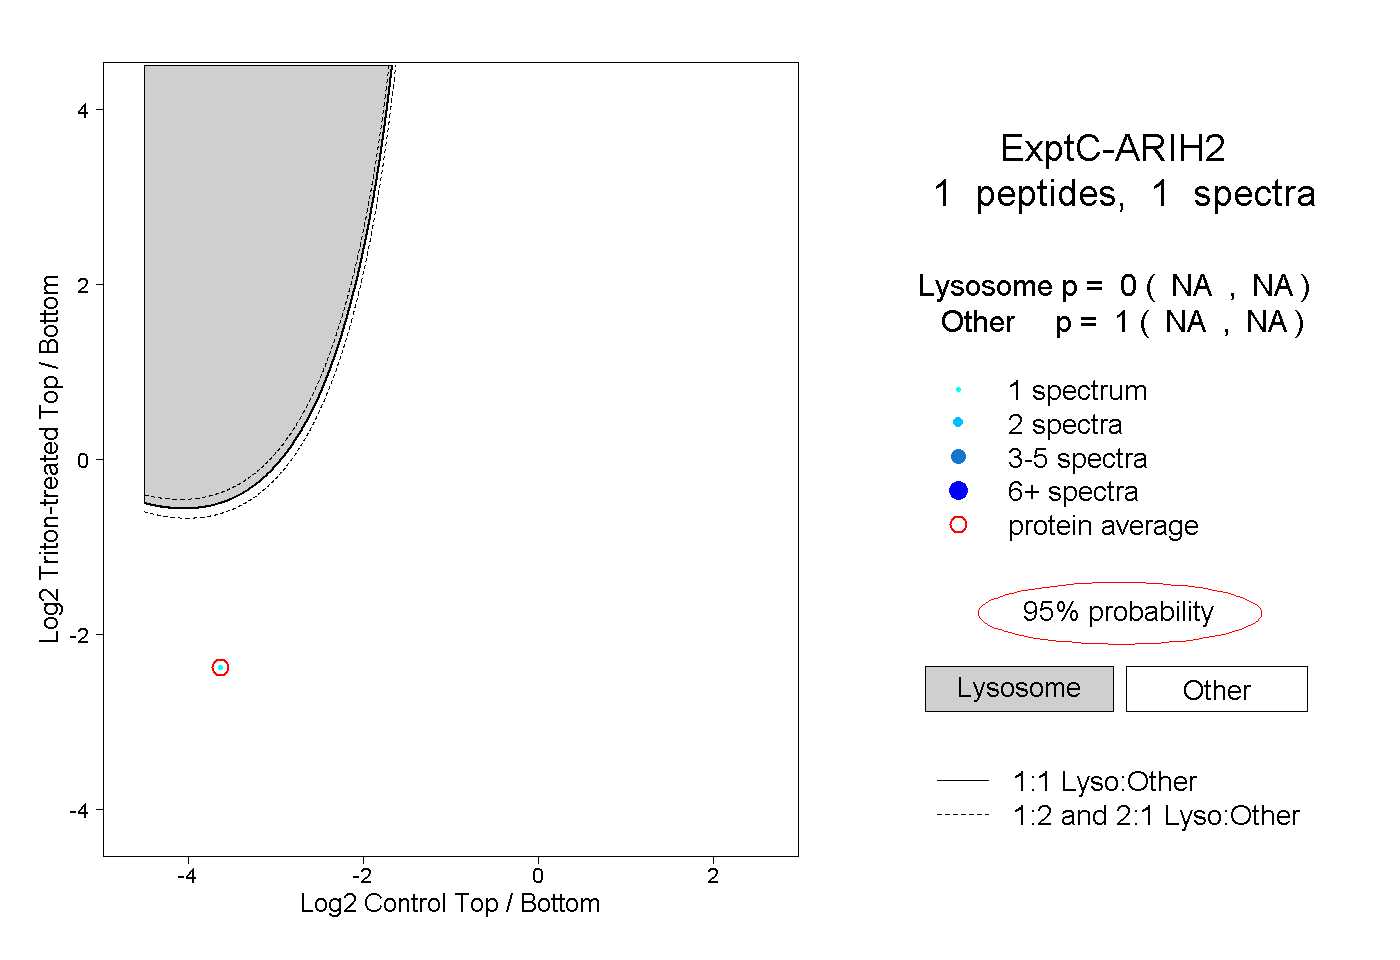
NA | NA
NA | NA
1peptide
spectrum
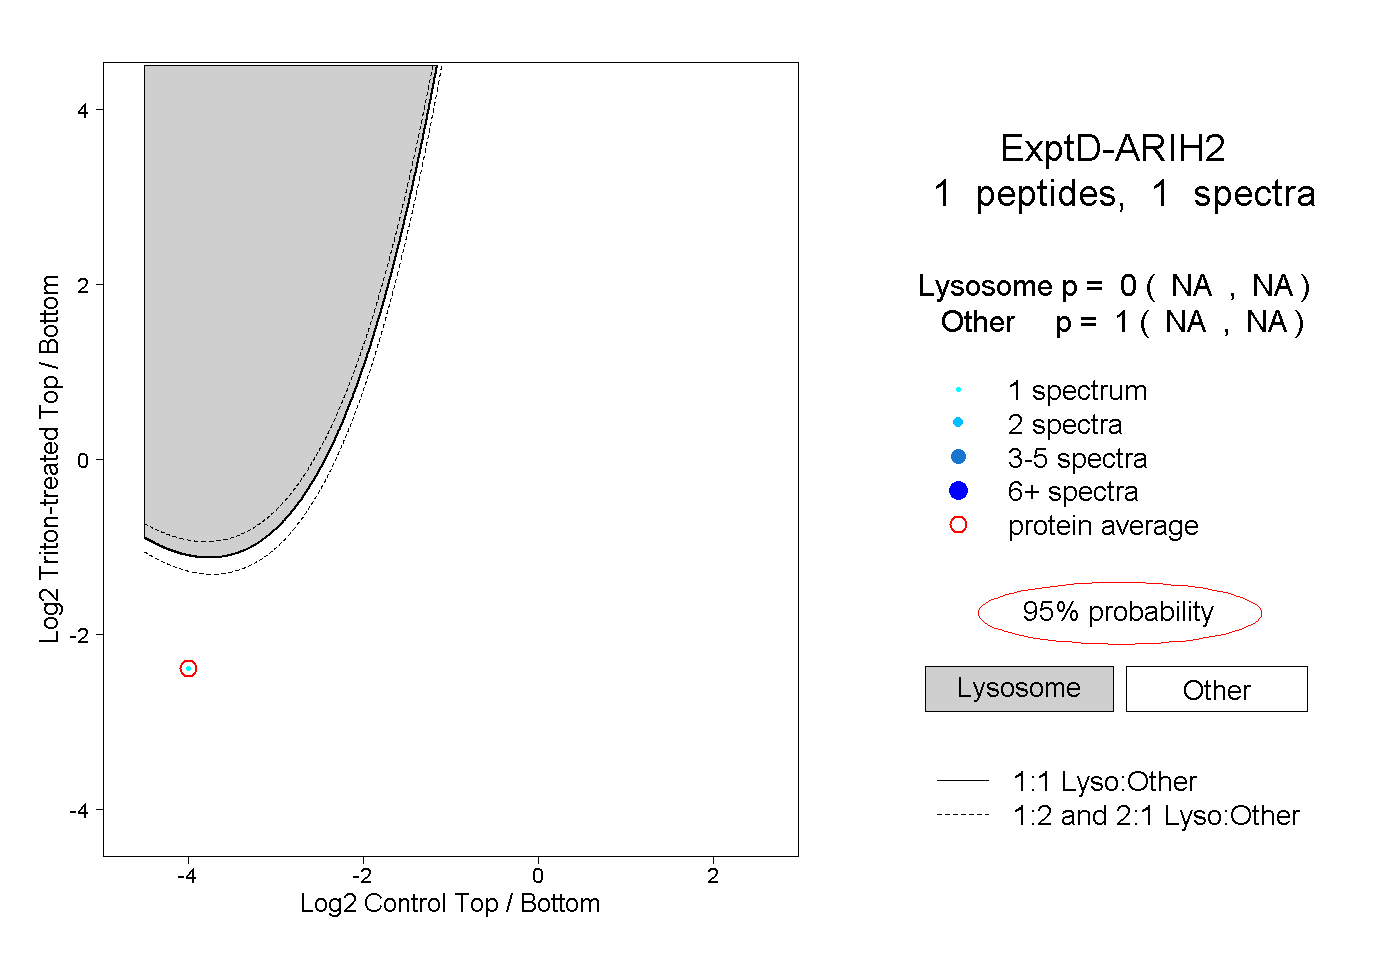
NA | NA
NA | NA