 5
5peptides
spectra
0.000 | 0.000
0.040 | 0.133
0.000 | 0.058
0.000 | 0.000
0.002 | 0.141
0.000 | 0.158
0.700 | 0.755
0.000 | 0.000
| Plot | Mito | Lyso | Perox | ER | Golgi | PM | Cytosol | Nucleus | |||||
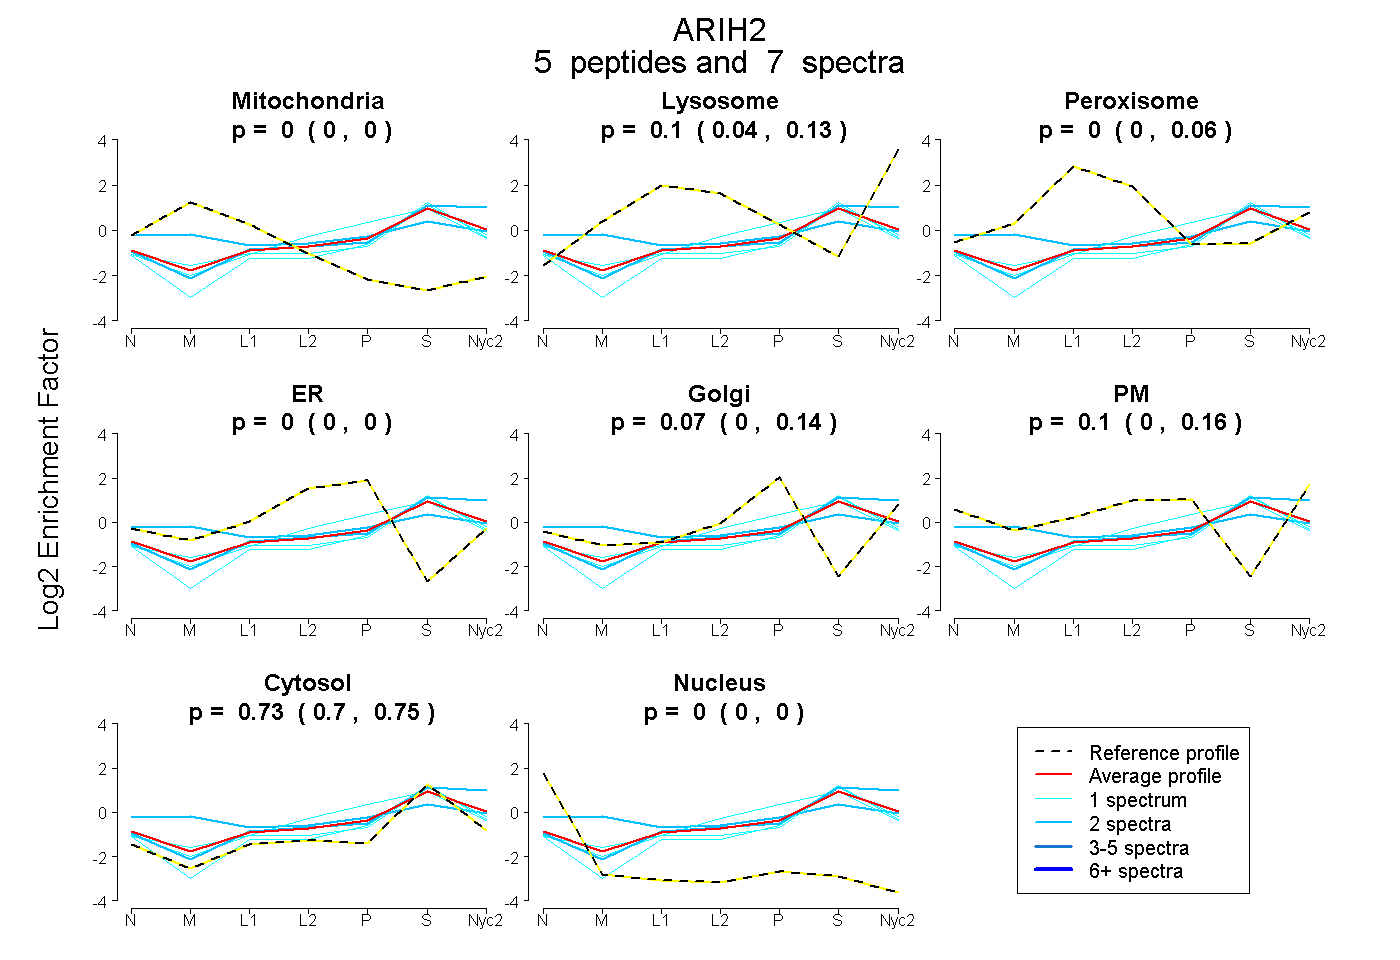
| Expt A |
5 peptides |
7 spectra |
|
0.000 0.000 | 0.000 |
0.101 0.040 | 0.133 |
0.000 0.000 | 0.058 |
0.000 0.000 | 0.000 |
0.065 0.002 | 0.141 |
0.099 0.000 | 0.158 |
0.735 0.700 | 0.755 |
0.000 0.000 | 0.000 |
| 1 spectrum, SLQLEAQTYQR | 0.004 | 0.097 | 0.017 | 0.000 | 0.061 | 0.020 | 0.800 | 0.000 | ||
| 1 spectrum, SNSAQLLVEAR | 0.000 | 0.000 | 0.000 | 0.000 | 0.107 | 0.000 | 0.893 | 0.000 | ||
| 1 spectrum, CNICIEK | 0.000 | 0.036 | 0.000 | 0.192 | 0.080 | 0.000 | 0.691 | 0.000 | ||
| 2 spectra, YLFYFER | 0.000 | 0.232 | 0.000 | 0.000 | 0.007 | 0.032 | 0.730 | 0.000 | ||
| 2 spectra, CNEVFCFK | 0.133 | 0.024 | 0.067 | 0.000 | 0.000 | 0.277 | 0.499 | 0.000 |
| Plot | Lyso | Other | |||||||||||
| Expt C |
1 peptide |
1 spectrum |
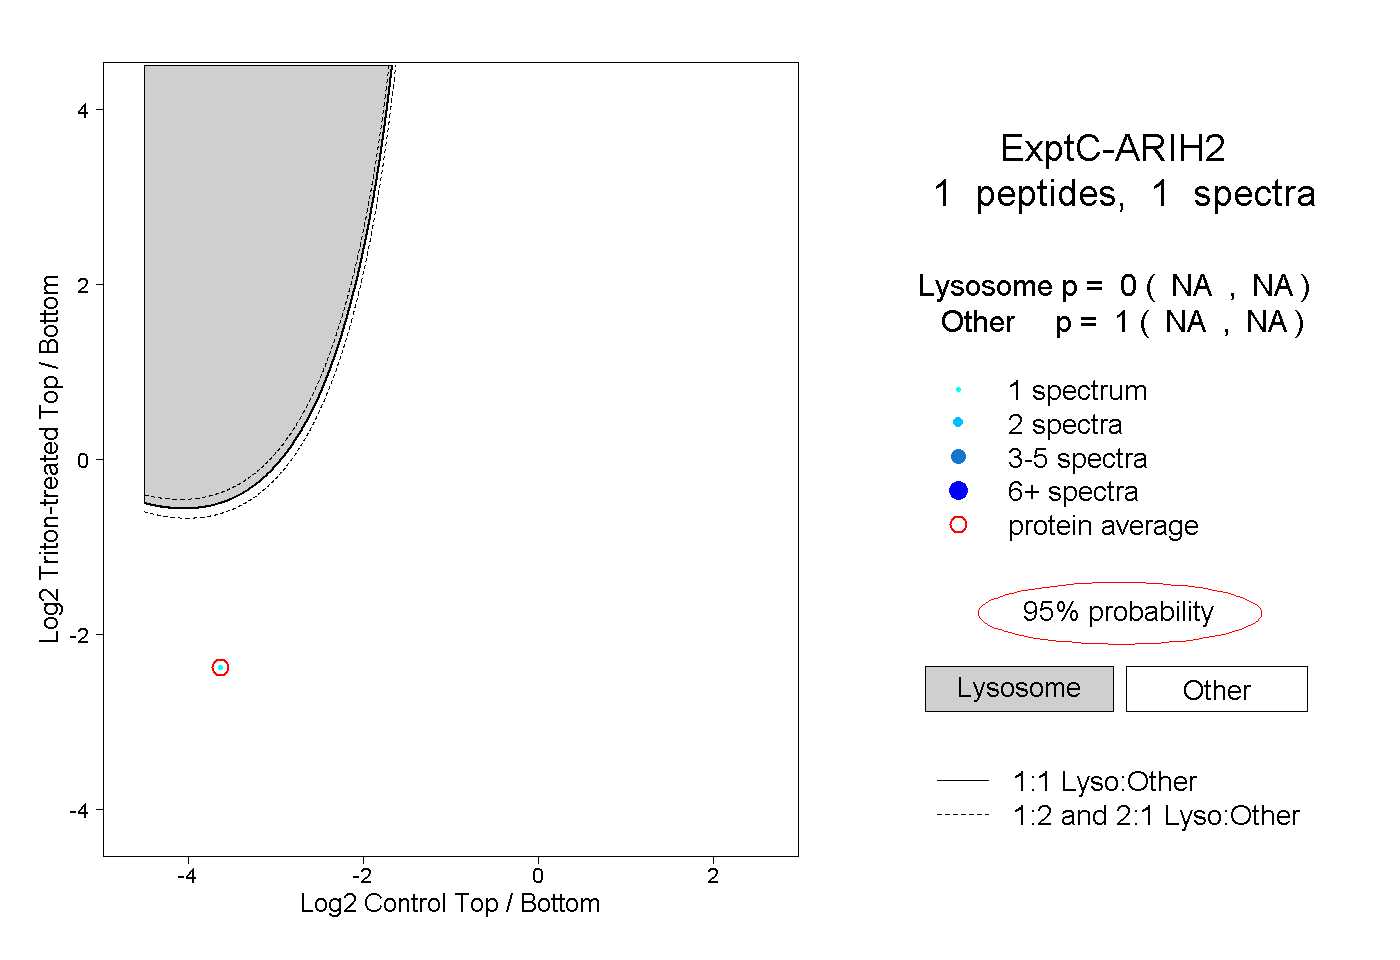 |
0.000 NA | NA |
1.000 NA | NA |
||||||||
| Plot | Lyso | Other | |||||||||||
| Expt D |
1 peptide |
1 spectrum |
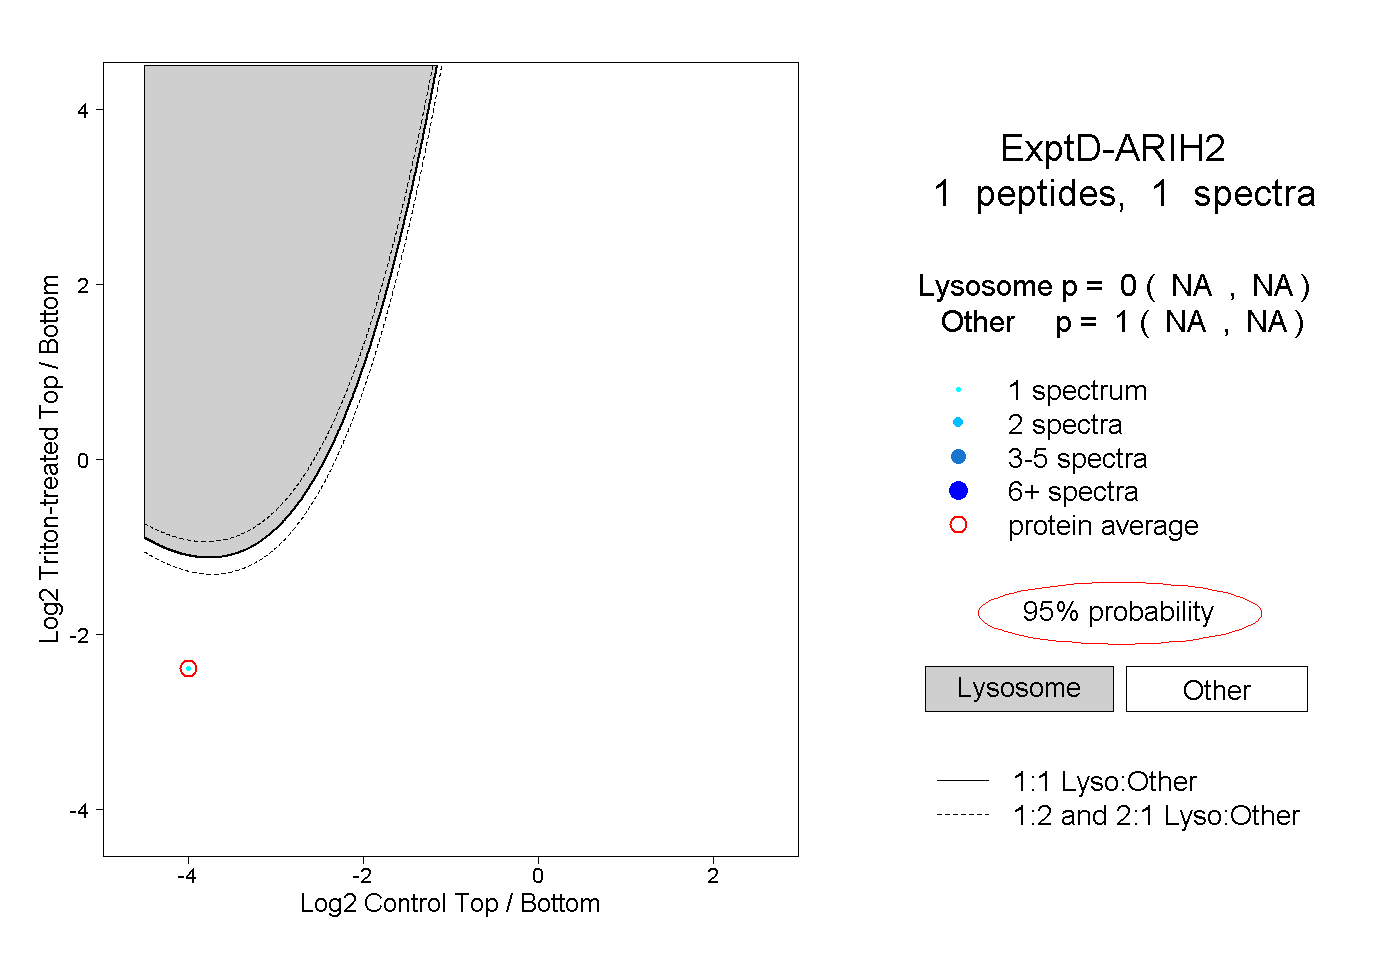 |
0.000 NA | NA |
1.000 NA | NA |