 5
5peptides
spectra
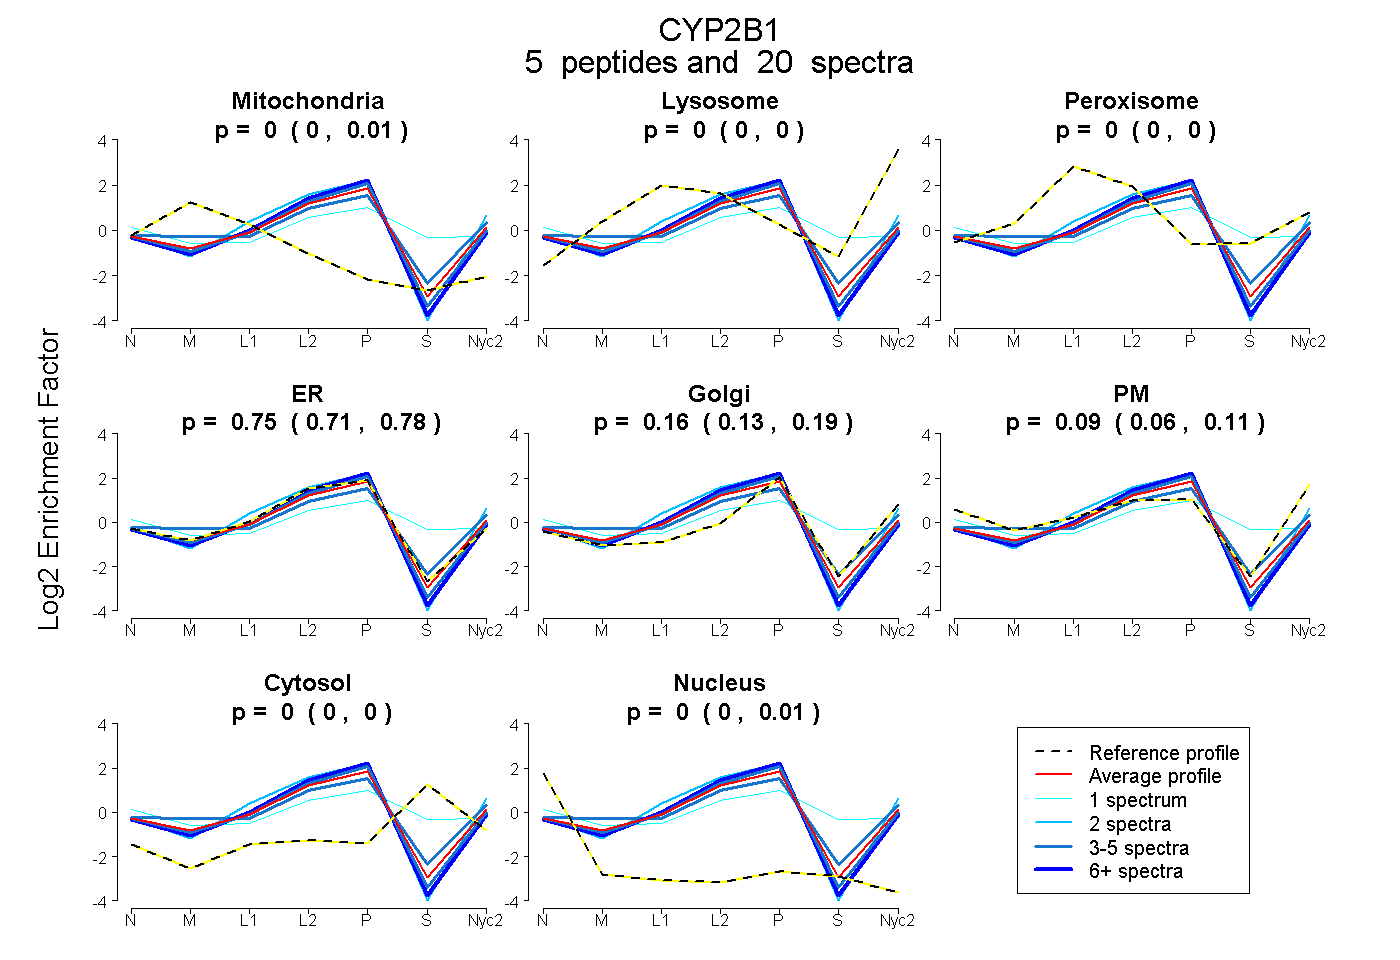
0.000 | 0.013
0.000 | 0.000
0.000 | 0.000
0.713 | 0.778
0.125 | 0.190
0.058 | 0.112
0.000 | 0.000
0.000 | 0.008
3peptides
spectra
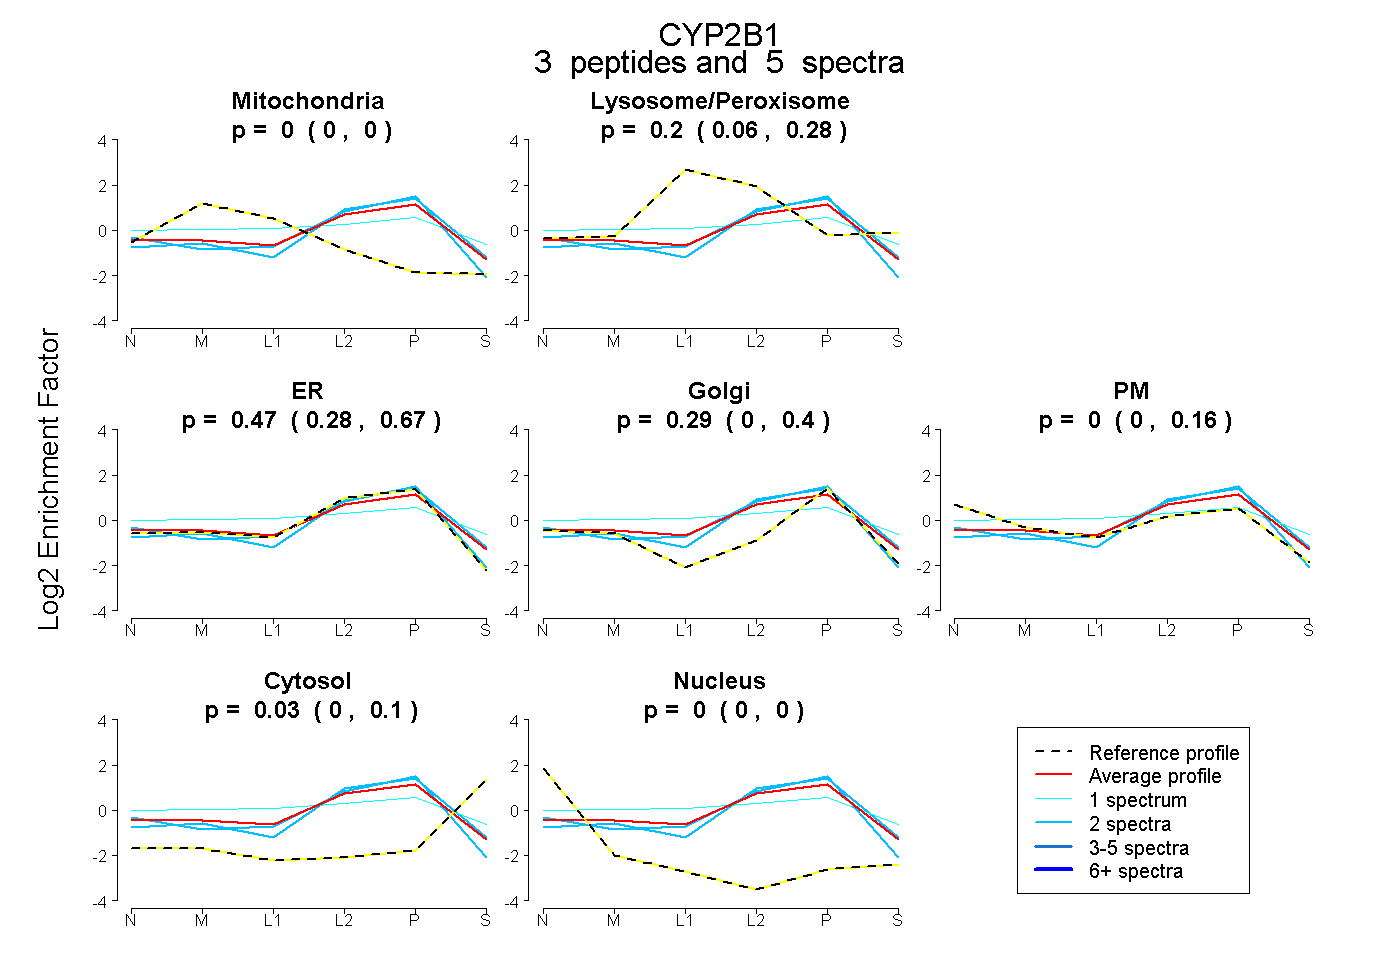
0.000 | 0.000
0.059 | 0.277
0.282 | 0.672
0.000 | 0.403
0.000 | 0.155
0.000 | 0.097
0.000 | 0.000
21peptides
spectra
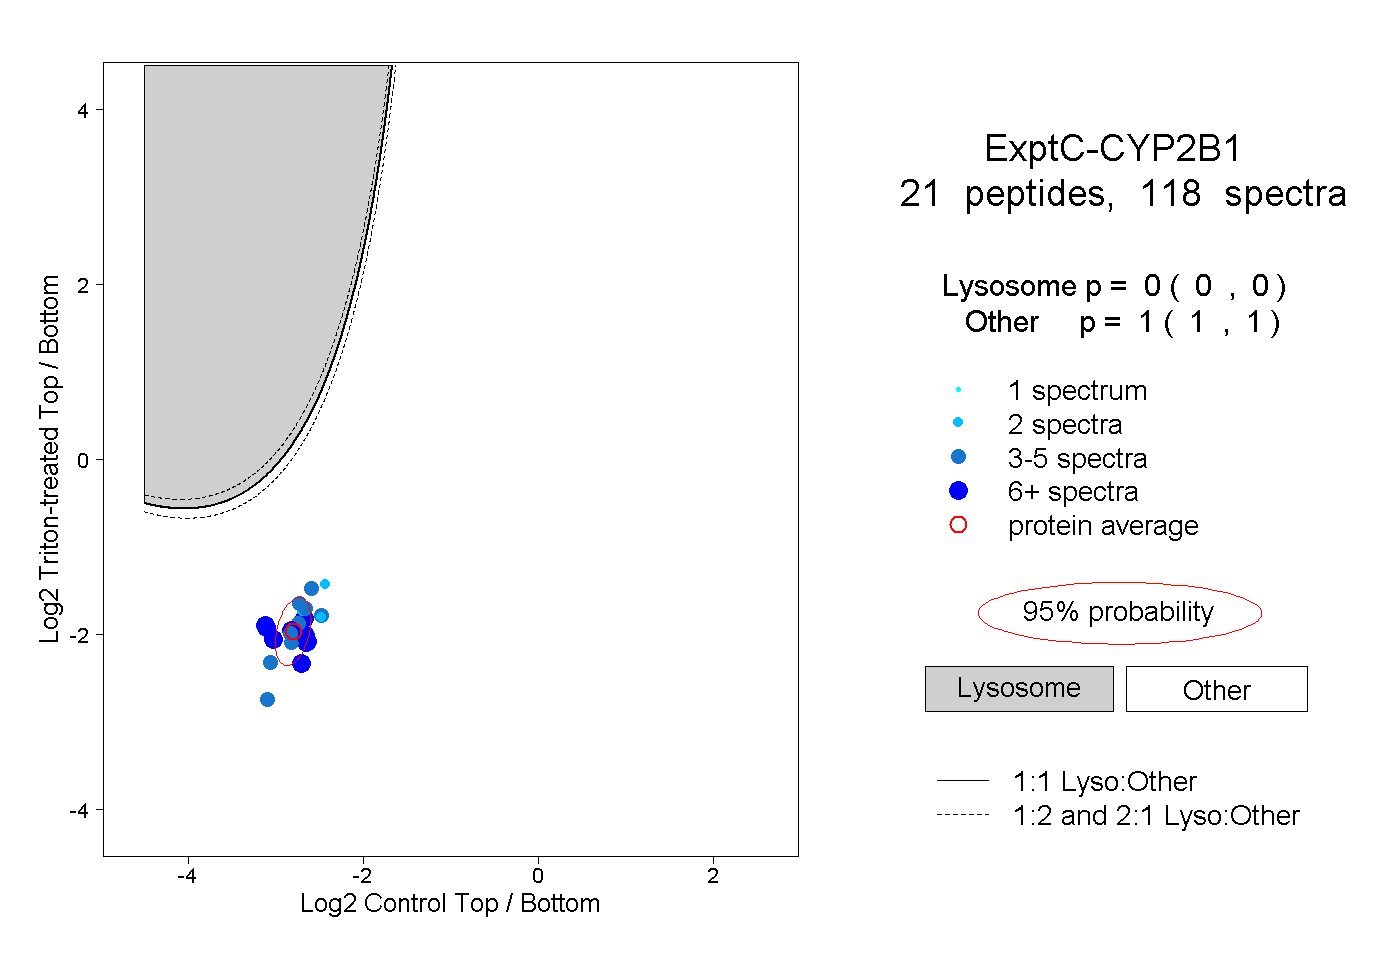
0.000 | 0.000
1.000 | 1.000