CYP2B1
[ENSRNOP00000049925]
Main page
| | | Plot |
Mito |
Lyso |
|
Perox |
ER |
Golgi |
PM |
Cytosol |
Nucleus |
|
| Expt A |
 5
5
peptides |
20
spectra |
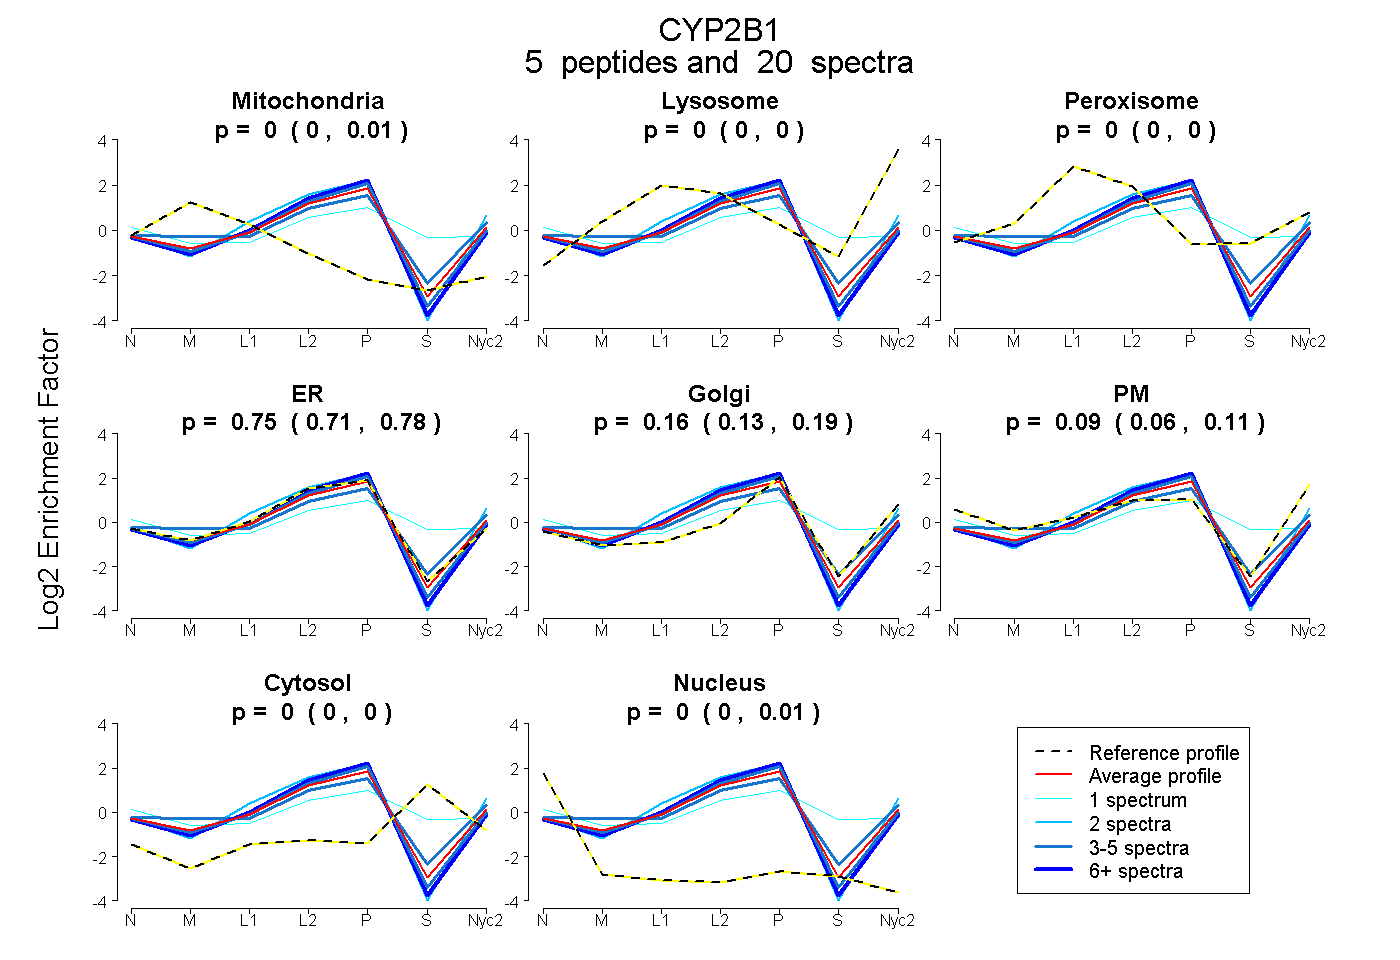 |
0.002
0.000 | 0.013 |
0.000
0.000 | 0.000 |
|
0.000
0.000 | 0.000 |
0.747
0.713 | 0.778 |
0.163
0.125 | 0.190 |
0.087
0.058 | 0.112 |
0.000
0.000 | 0.000 |
0.000
0.000 | 0.008 |
|
| | | Plot |
Mito |
|
Lyso or Perox |
|
ER |
Golgi |
PM |
Cytosol |
Nucleus |
|
| Expt B |
3
peptides |
5
spectra |
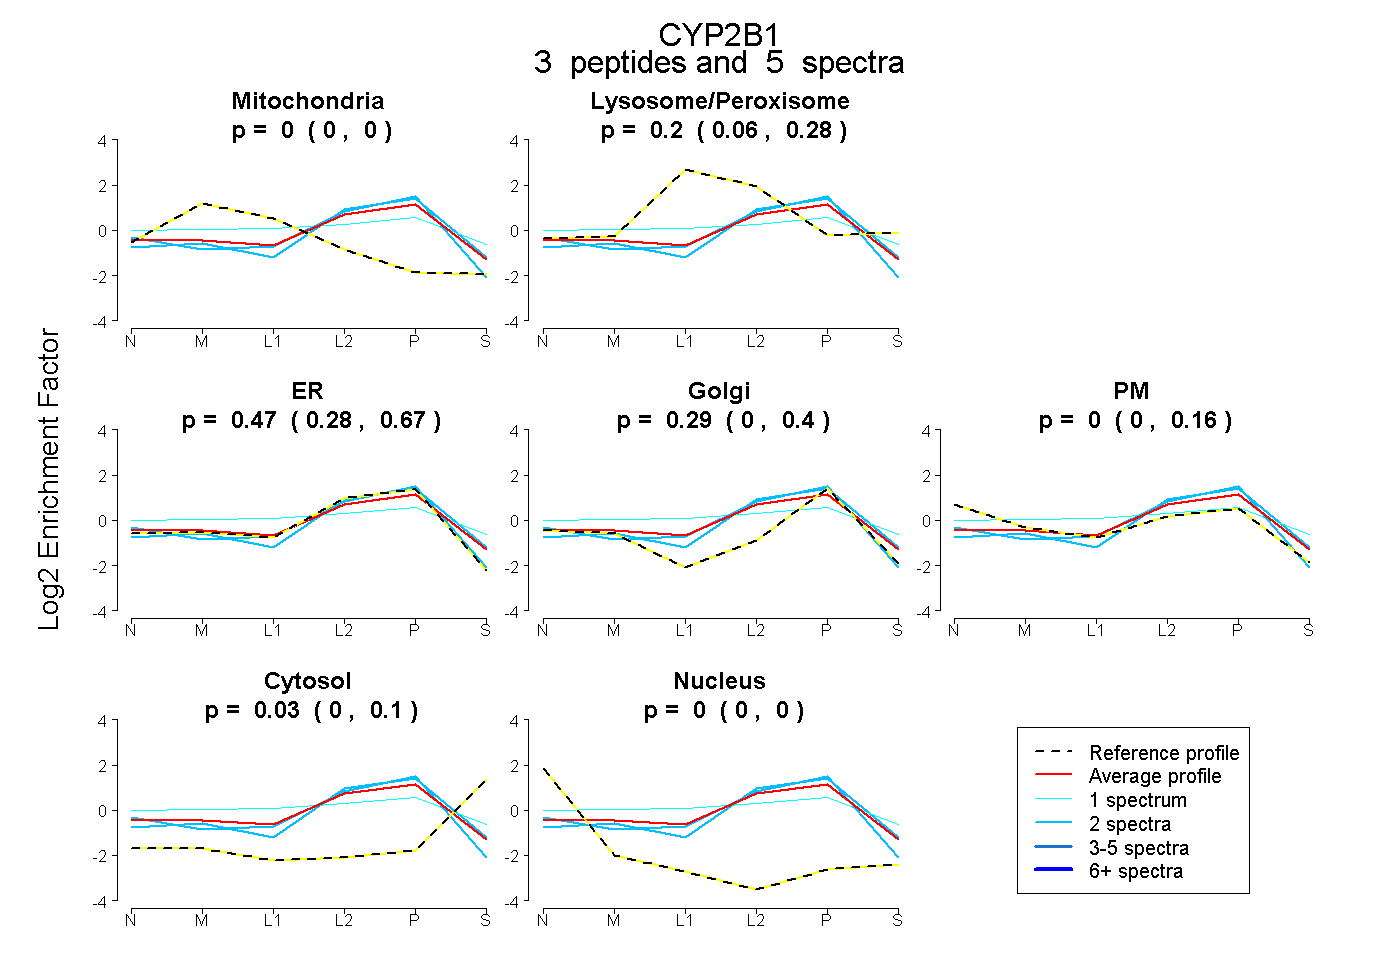 |
0.000
0.000 | 0.000 |
|
0.203
0.059 | 0.277 |
|
0.475
0.282 | 0.672 |
0.295
0.000 | 0.403 |
0.001
0.000 | 0.155 |
0.026
0.000 | 0.097 |
0.000
0.000 | 0.000 |
|
| 2 spectra, LPTLDDR |
0.000 |
|
0.007 |
|
0.880 |
0.028 |
0.085 |
0.000 |
0.000 |
|
| 2 spectra, EIDQVIGSHR |
0.000 |
|
0.003 |
|
0.873 |
0.000 |
0.000 |
0.124 |
0.000 |
|
| 1 spectrum, EYGVIFANGER |
0.012 |
|
0.393 |
|
0.000 |
0.301 |
0.237 |
0.058 |
0.000 |
|
| | | Plot |
|
Lyso |
|
|
|
|
|
|
|
Other |
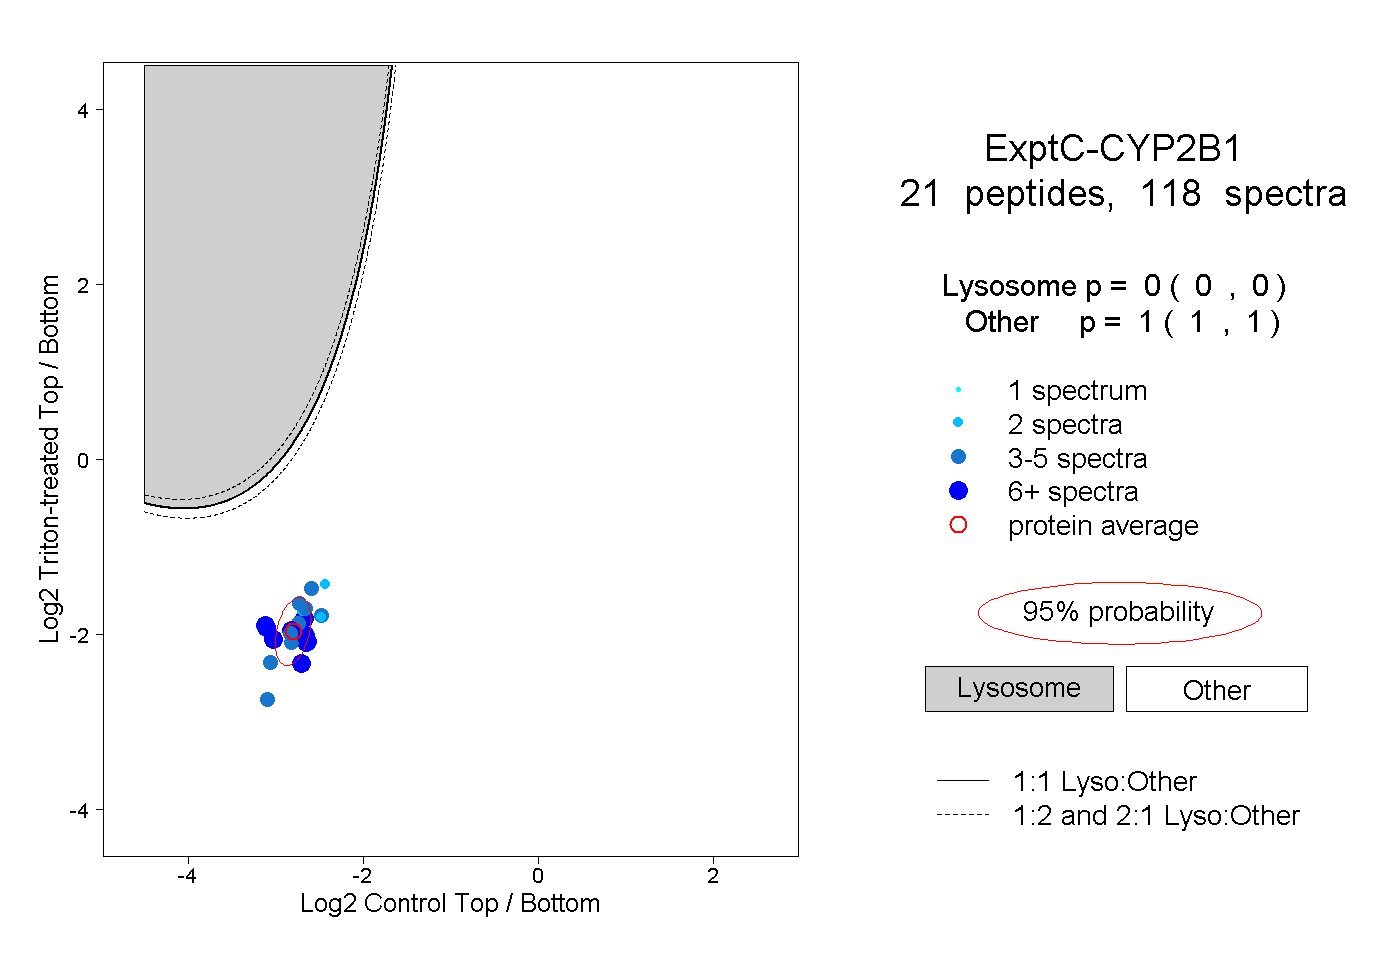
| Expt C |
21
peptides |
118
spectra |
 |
|
0.000
0.000 | 0.000 |
|
|
|
|
|
|
|
1.000
1.000 | 1.000 |