 4
4peptides
spectra
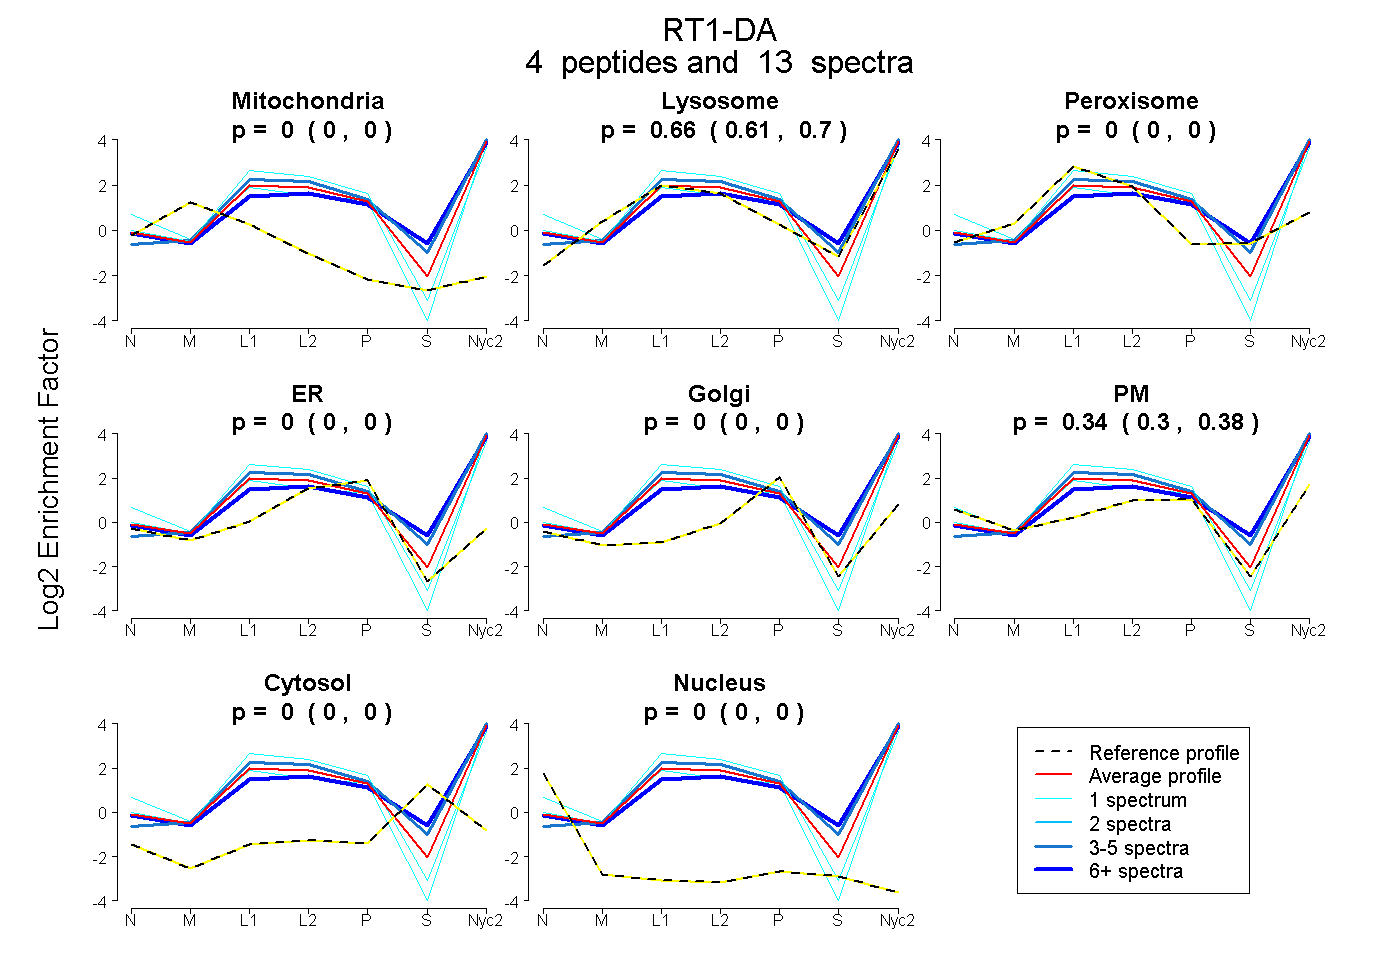
0.000 | 0.000
0.609 | 0.696
0.000 | 0.000
0.000 | 0.000
0.000 | 0.000
0.296 | 0.381
0.000 | 0.000
0.000 | 0.000
7peptides
spectra
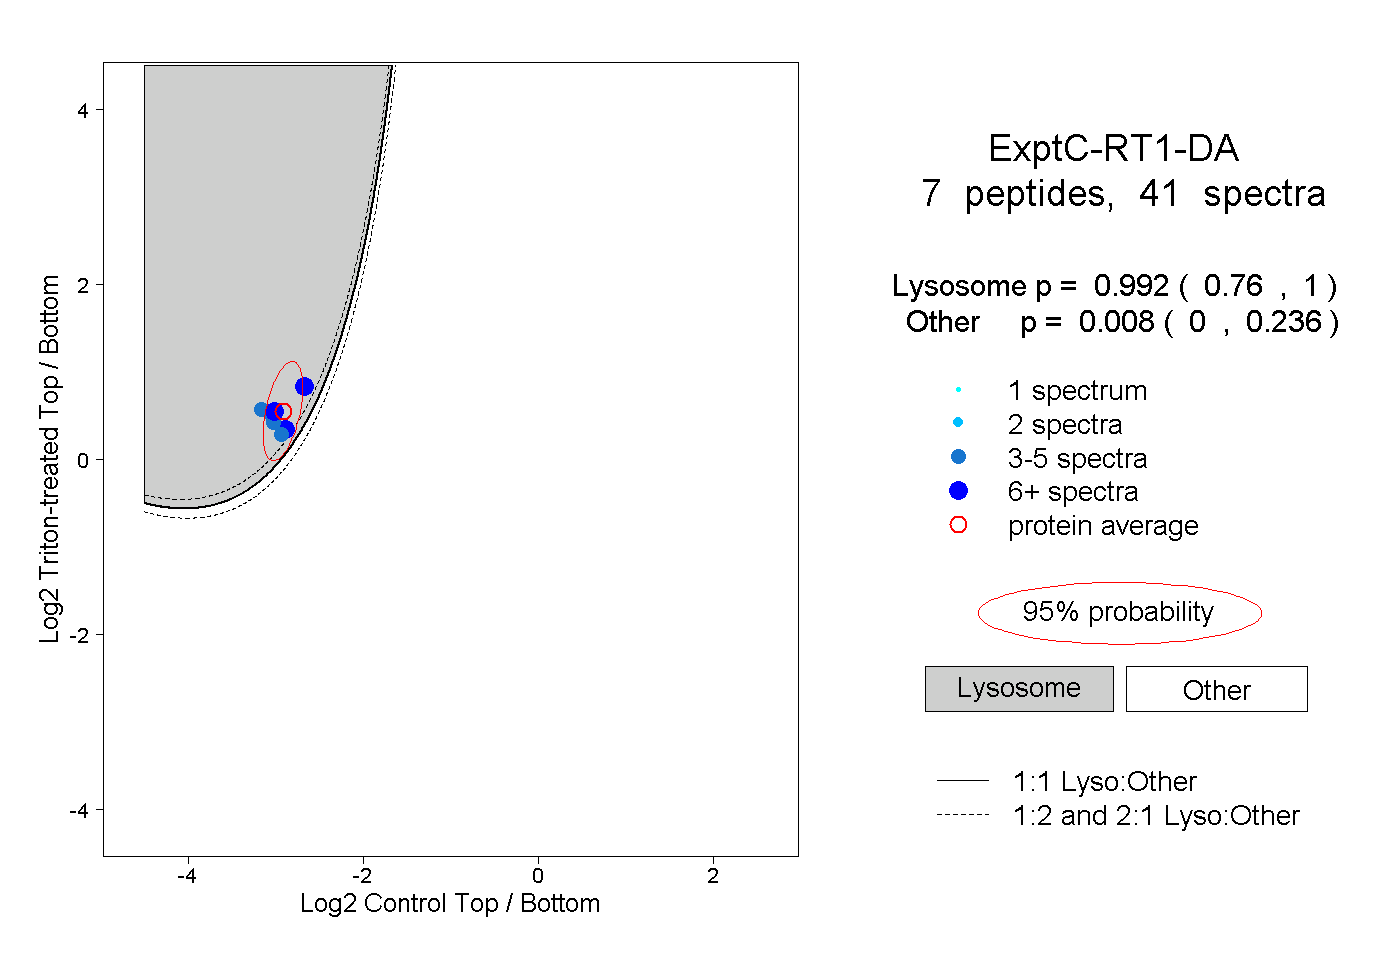
0.760 | 1.000
0.000 | 0.236
4peptides
spectra
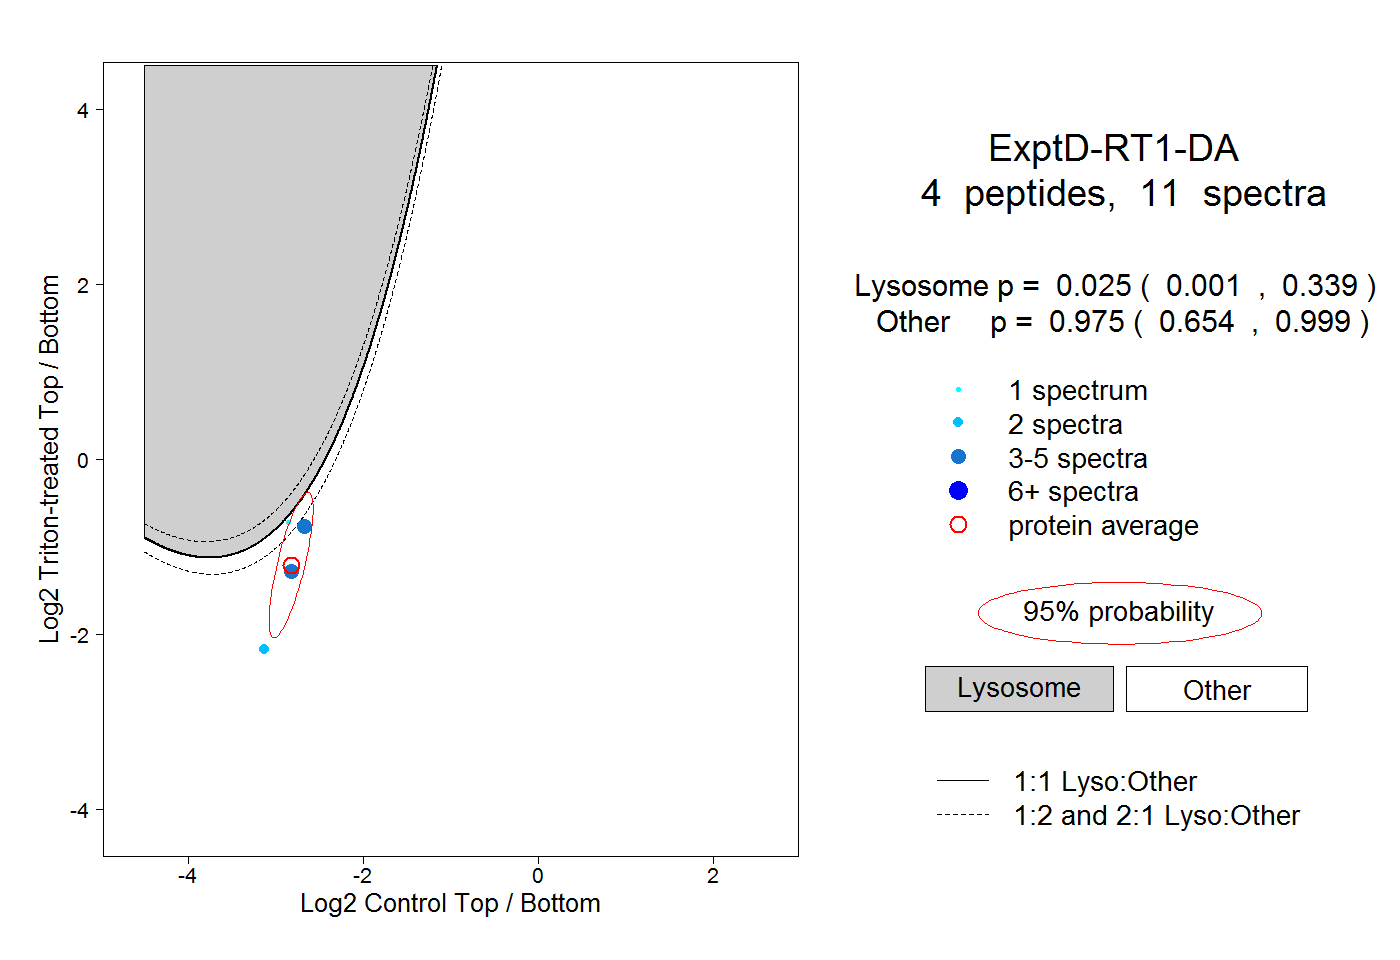
0.001 | 0.339
0.654 | 0.999