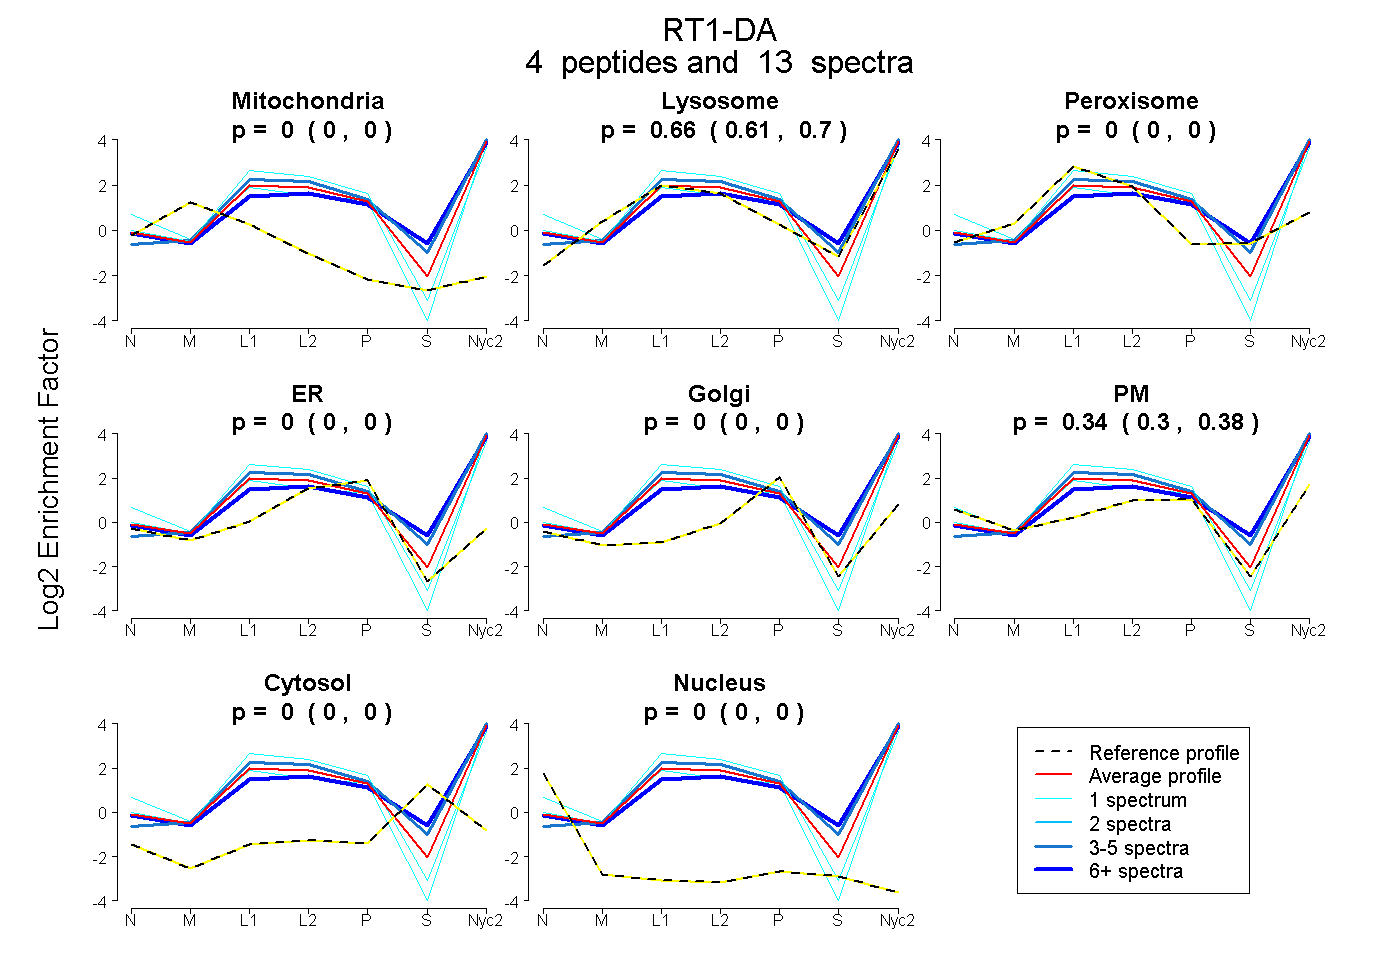
 4
4peptides
spectra
0.000 | 0.000
0.609 | 0.696
0.000 | 0.000
0.000 | 0.000
0.000 | 0.000
0.296 | 0.381
0.000 | 0.000
0.000 | 0.000
| Plot | Mito | Lyso | Perox | ER | Golgi | PM | Cytosol | Nucleus | |||||
| Expt A |
4 peptides |
13 spectra |
|
0.000 0.000 | 0.000 |
0.659 0.609 | 0.696 |
0.000 0.000 | 0.000 |
0.000 0.000 | 0.000 |
0.000 0.000 | 0.000 |
0.341 0.296 | 0.381 |
0.000 0.000 | 0.000 |
0.000 0.000 | 0.000 |
| 1 spectrum, ANLDIMIK | 0.000 | 0.356 | 0.000 | 0.000 | 0.000 | 0.644 | 0.000 | 0.000 | ||
| 1 spectrum, SPVNLGEPNILICFIDK | 0.000 | 0.603 | 0.000 | 0.000 | 0.000 | 0.397 | 0.000 | 0.000 | ||
| 7 spectra, EDHLFR | 0.000 | 0.728 | 0.000 | 0.000 | 0.000 | 0.272 | 0.000 | 0.000 | ||
| 4 spectra, GVSETVFLPR | 0.000 | 0.889 | 0.000 | 0.000 | 0.000 | 0.111 | 0.000 | 0.000 |
| Plot | Lyso | Other | |||||||||||
| Expt C |
7 peptides |
41 spectra |
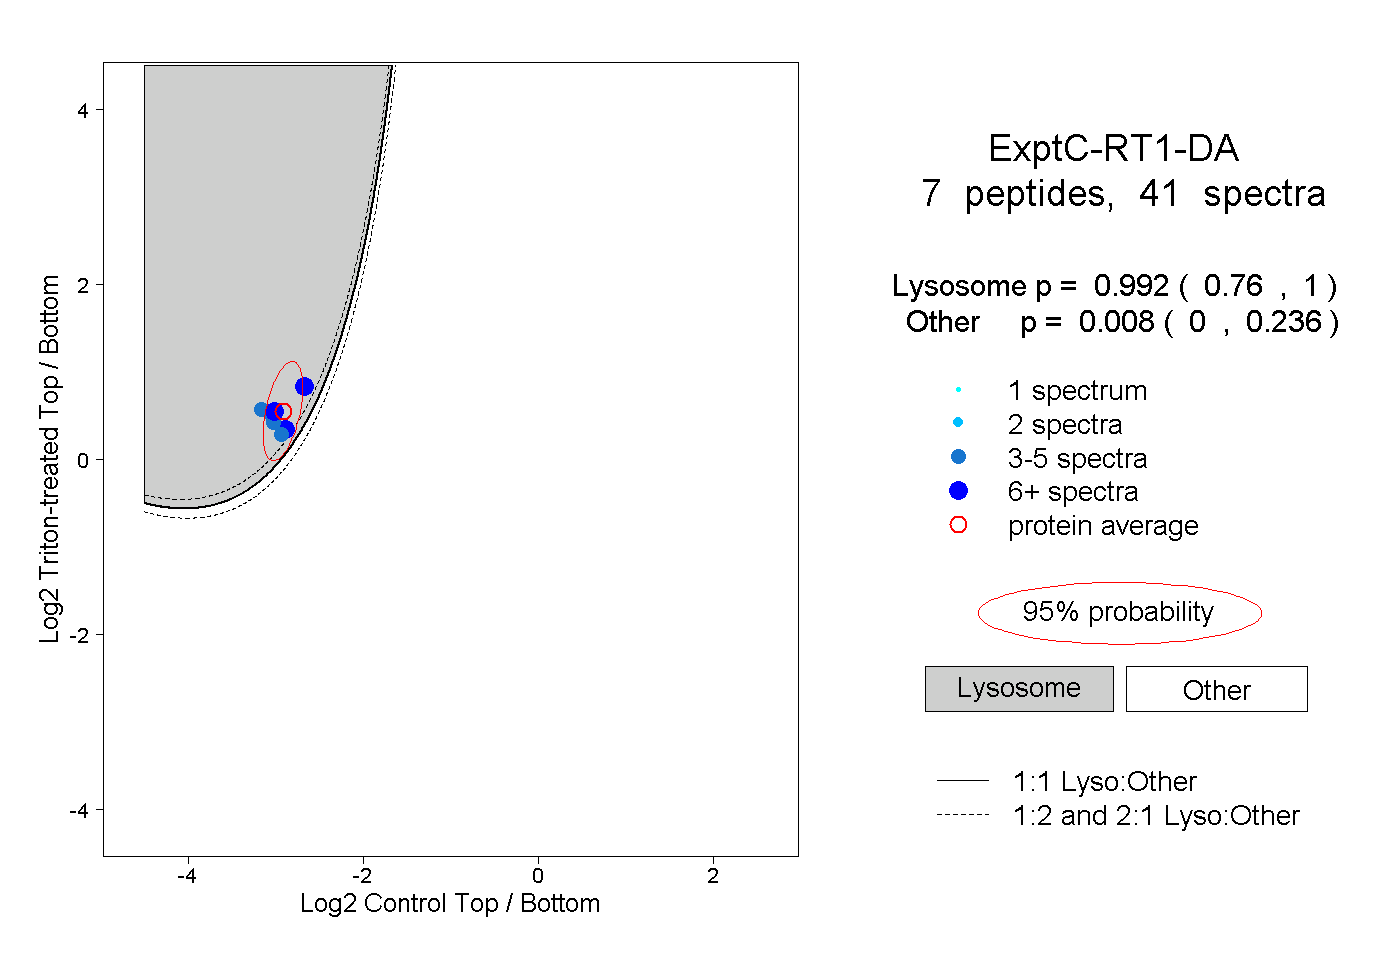 |
0.992 0.760 | 1.000 |
0.008 0.000 | 0.236 |
||||||||
| Plot | Lyso | Other | |||||||||||
| Expt D |
4 peptides |
11 spectra |
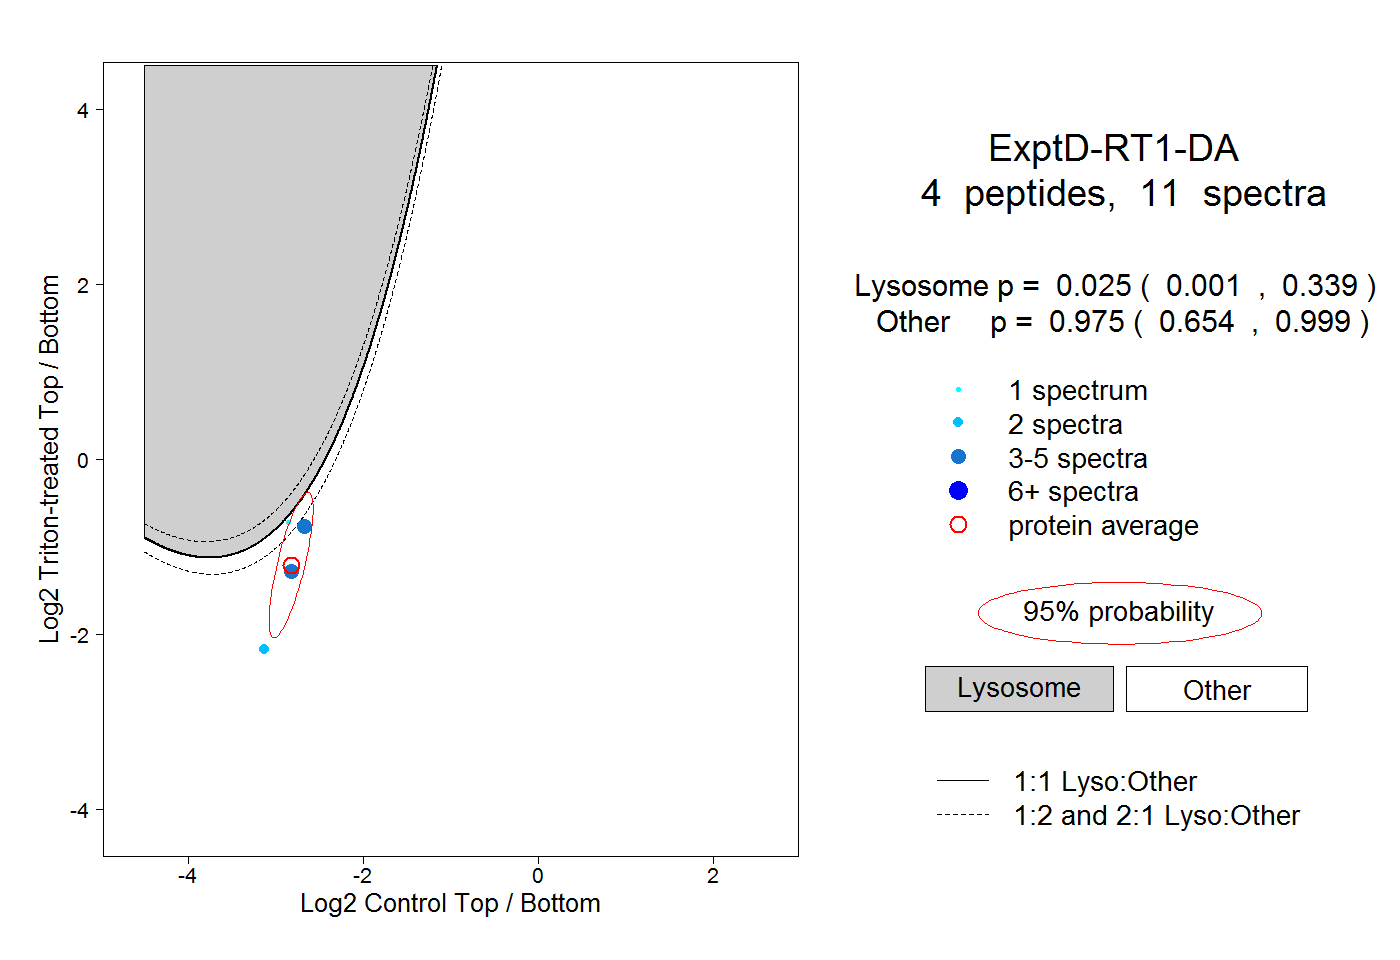 |
0.025 0.001 | 0.339 |
0.975 0.654 | 0.999 |