 36
36peptides
spectra
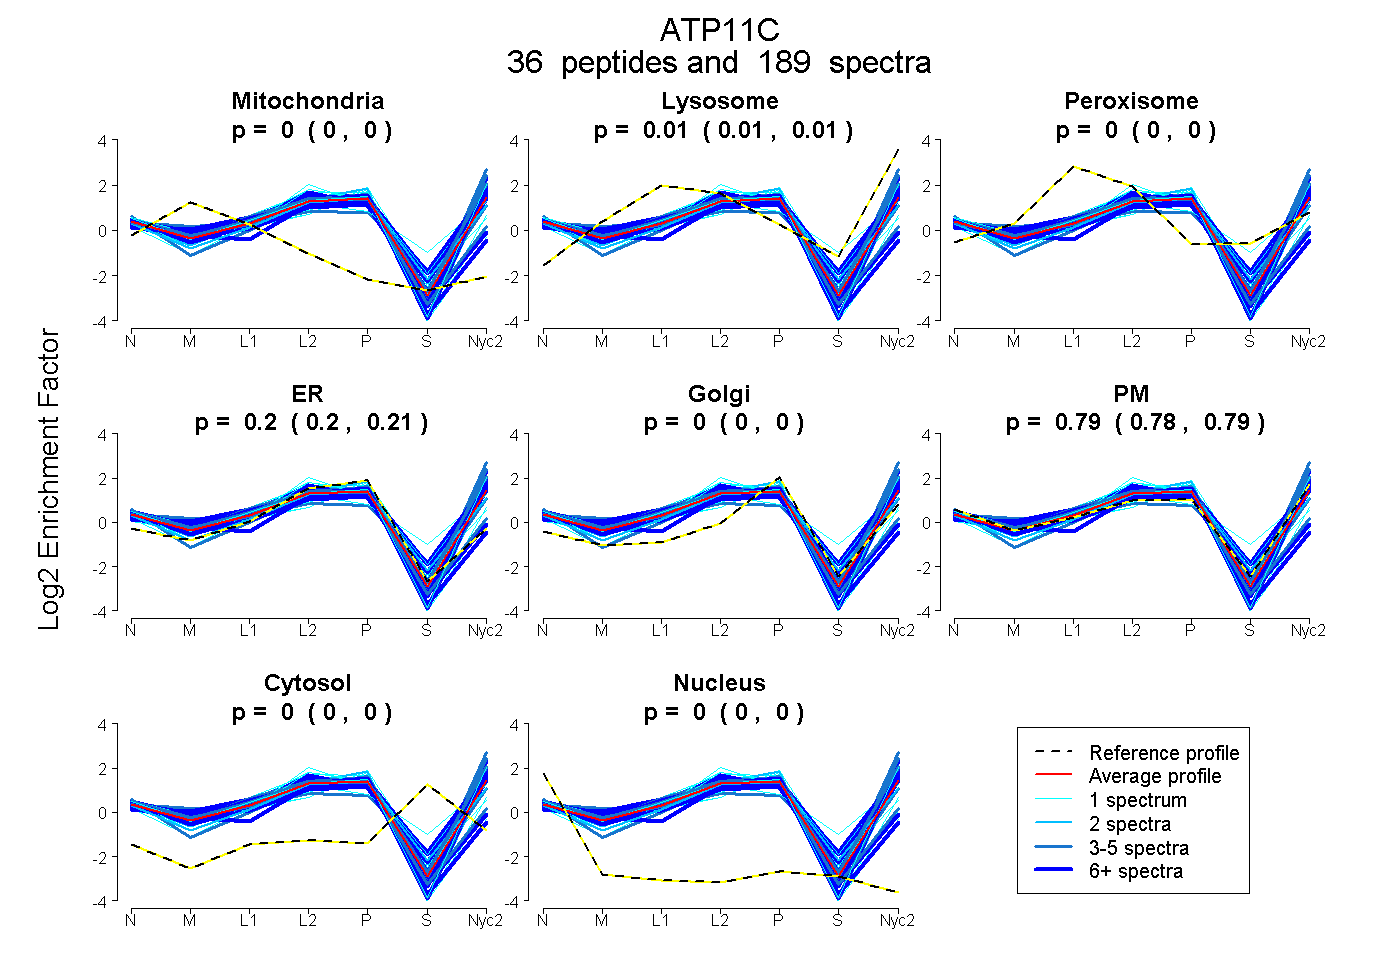
0.000 | 0.000
0.007 | 0.012
0.000 | 0.000
0.199 | 0.210
0.000 | 0.000
0.780 | 0.790
0.000 | 0.000
0.000 | 0.000
18peptides
spectra
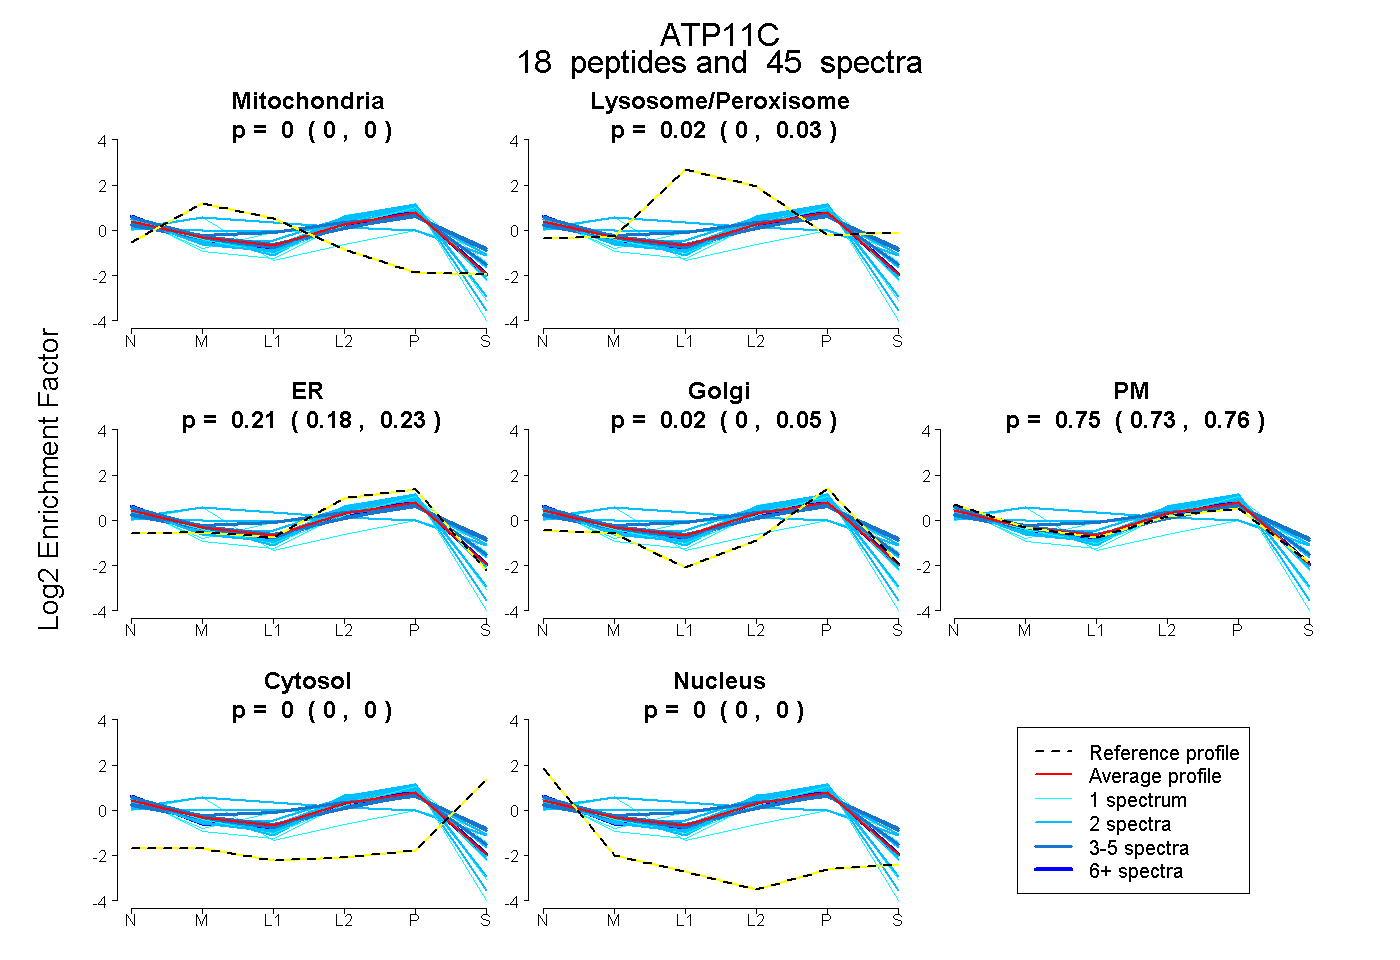
0.000 | 0.004
0.000 | 0.029
0.180 | 0.232
0.000 | 0.045
0.733 | 0.762
0.000 | 0.000
0.000 | 0.000
32peptides
spectra
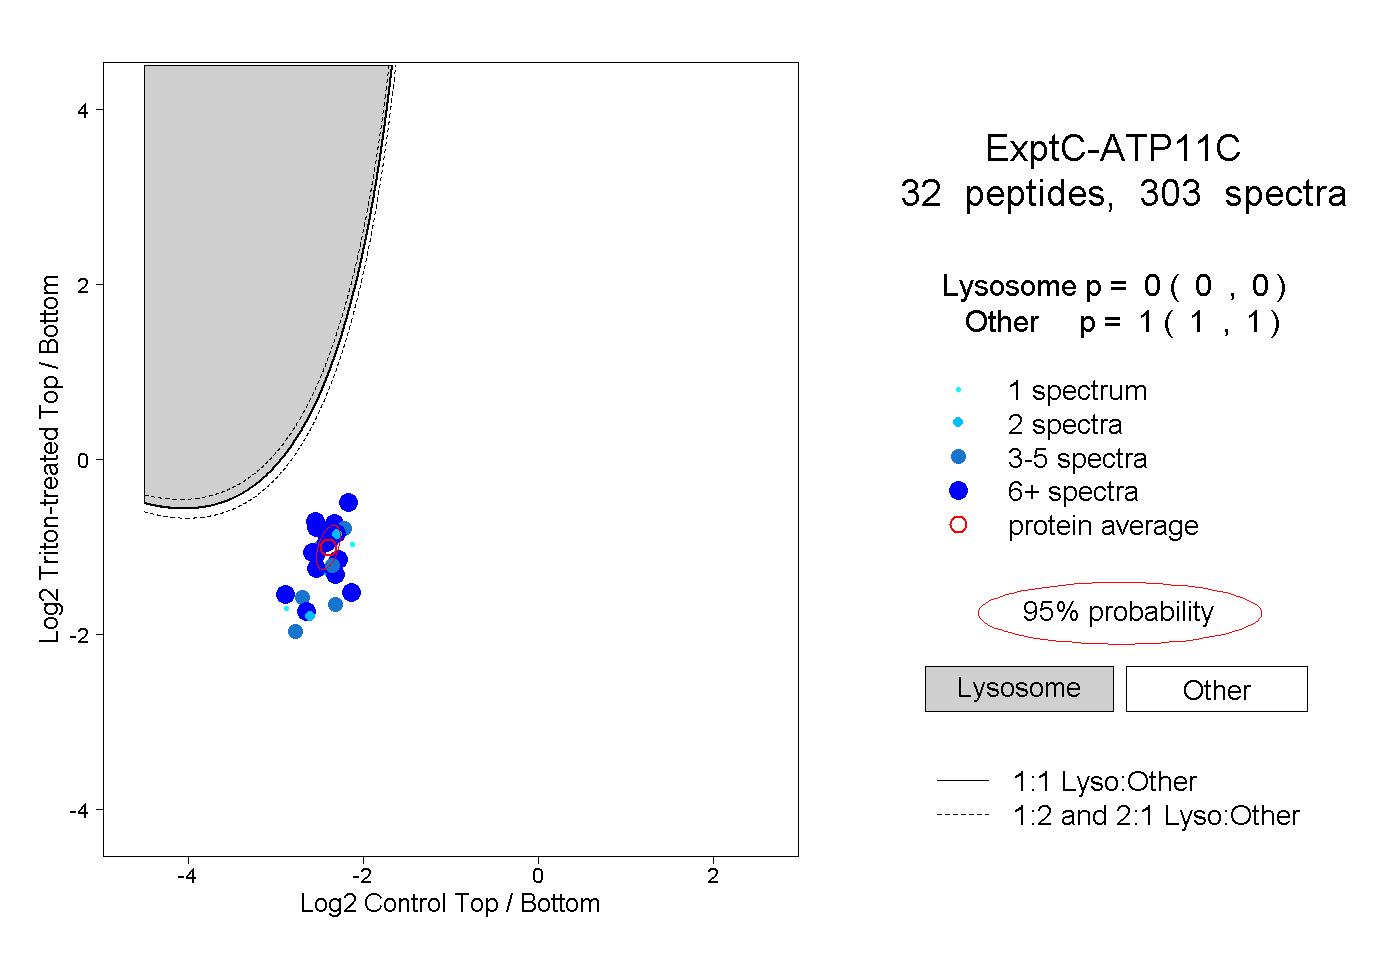
0.000 | 0.000
1.000 | 1.000
10peptides
spectra
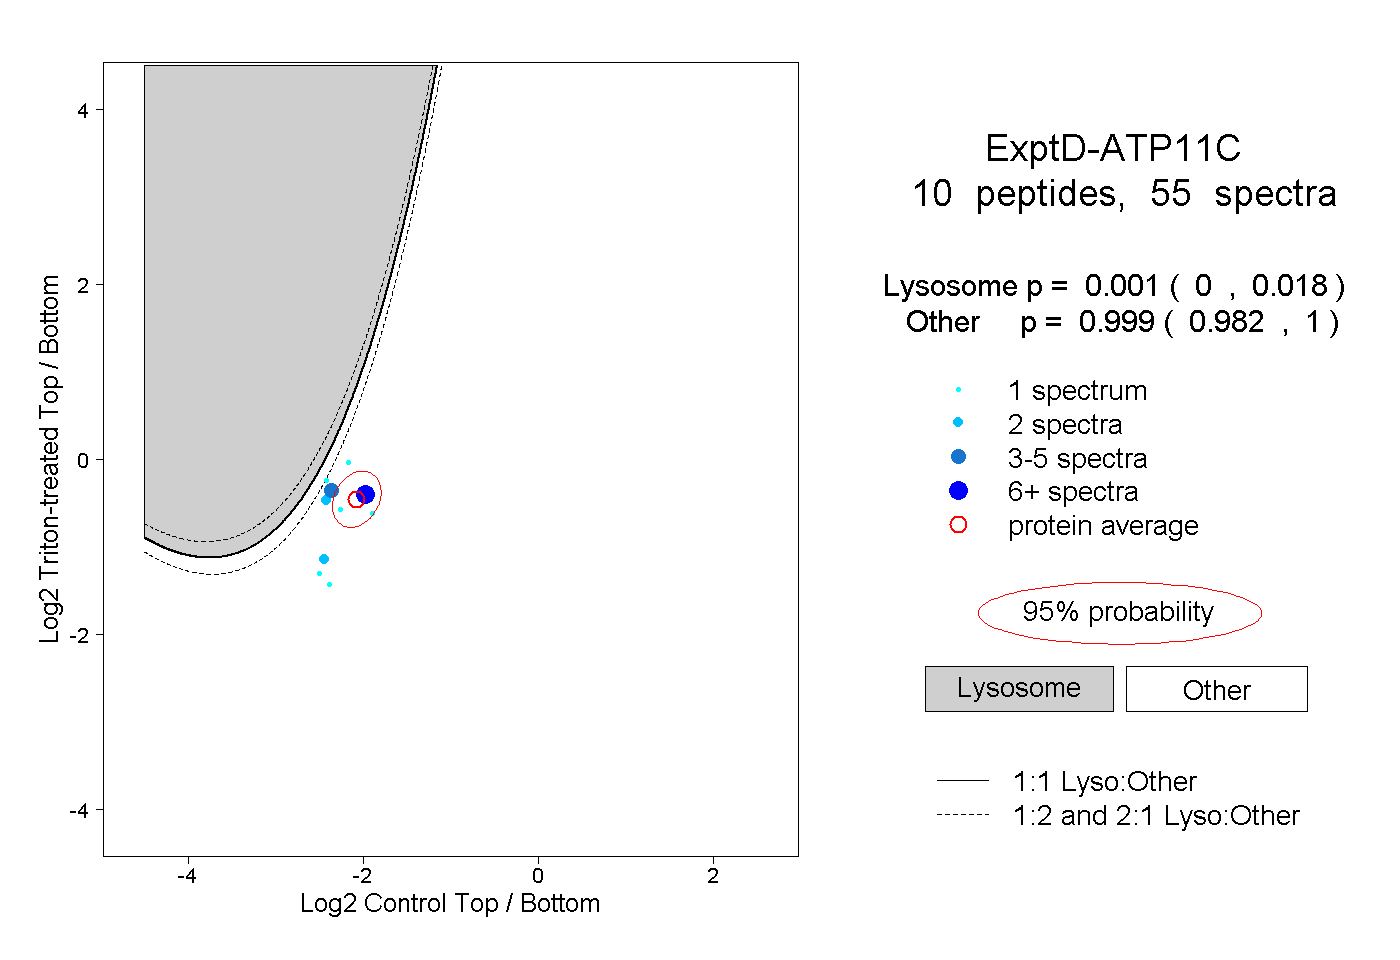
0.000 | 0.018
0.982 | 1.000