 2
2peptides
spectra
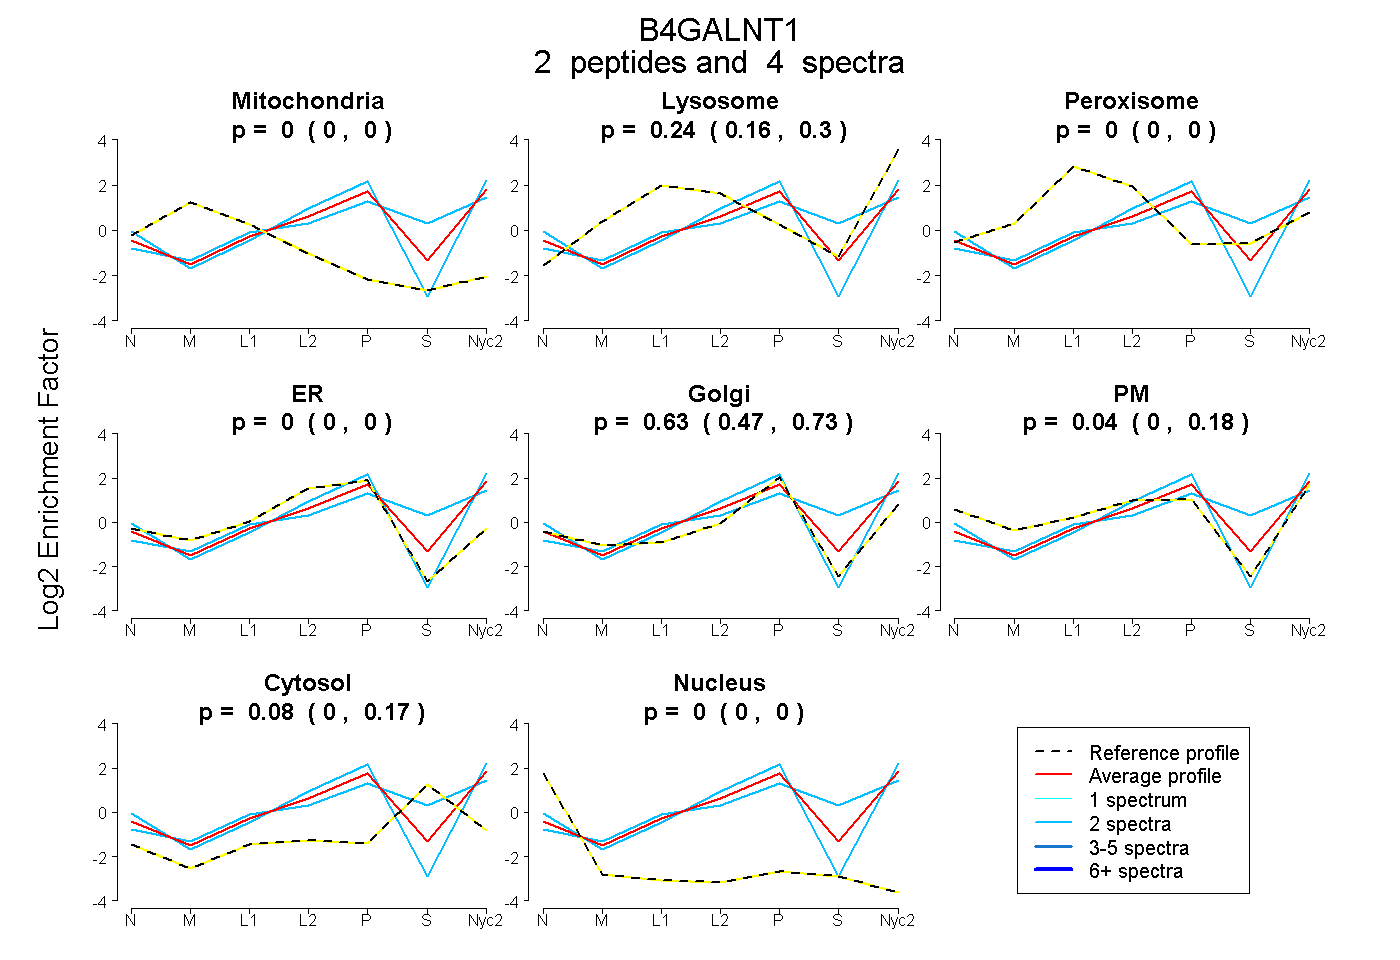
0.000 | 0.000
0.159 | 0.297
0.000 | 0.000
0.000 | 0.000
0.469 | 0.727
0.000 | 0.178
0.000 | 0.169
0.000 | 0.000
1peptide
spectra
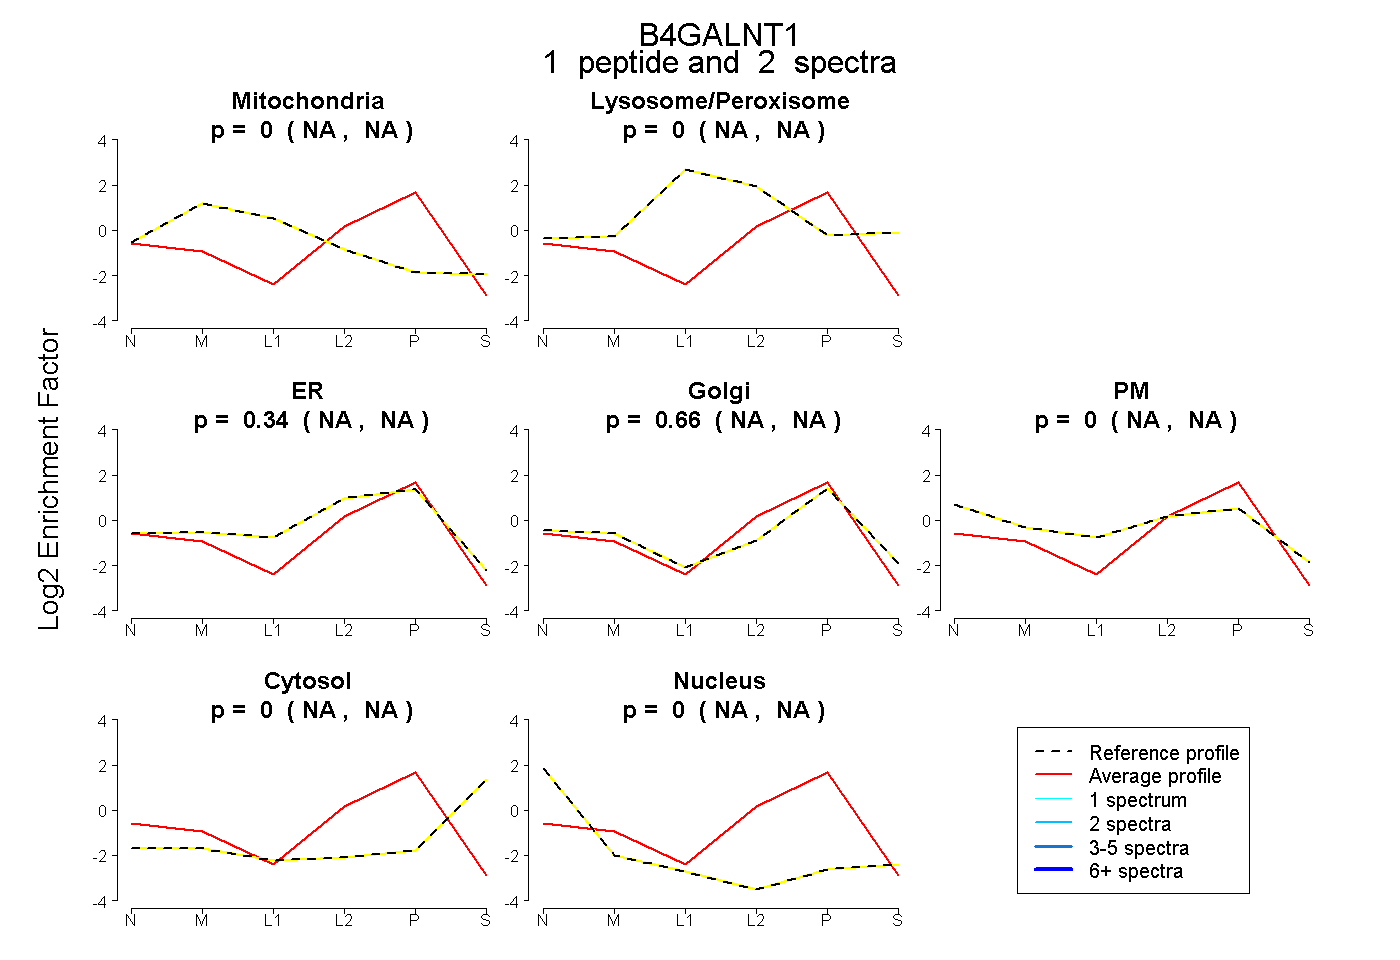
NA | NA
NA | NA
NA | NA
NA | NA
NA | NA
NA | NA
NA | NA
10peptides
spectra
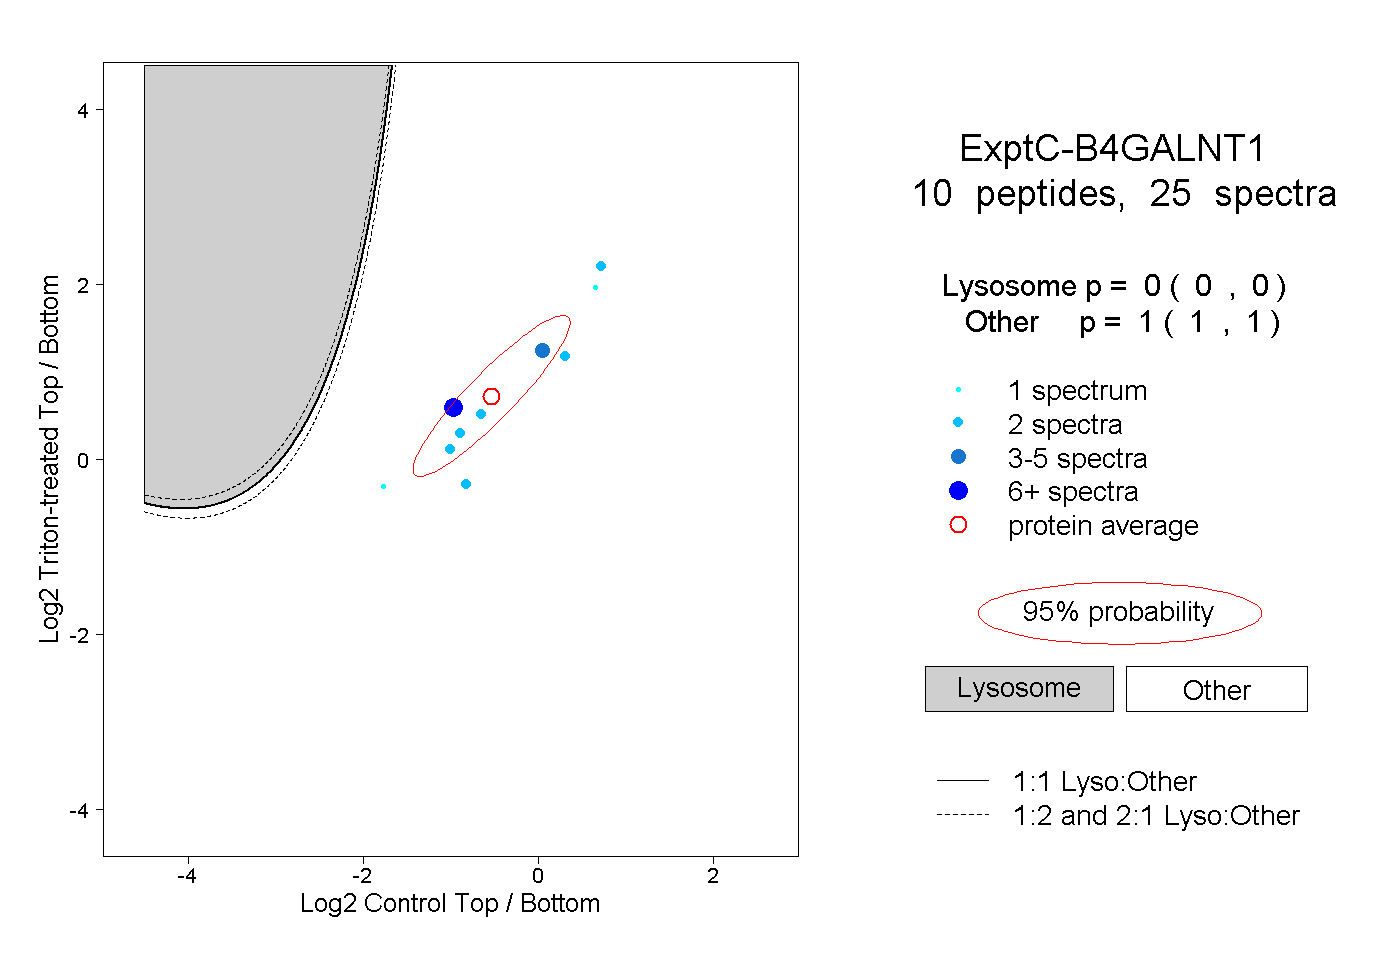
0.000 | 0.000
1.000 | 1.000