 2
2peptides
spectra
0.000 | 0.000
0.159 | 0.297
0.000 | 0.000
0.000 | 0.000
0.469 | 0.727
0.000 | 0.178
0.000 | 0.169
0.000 | 0.000
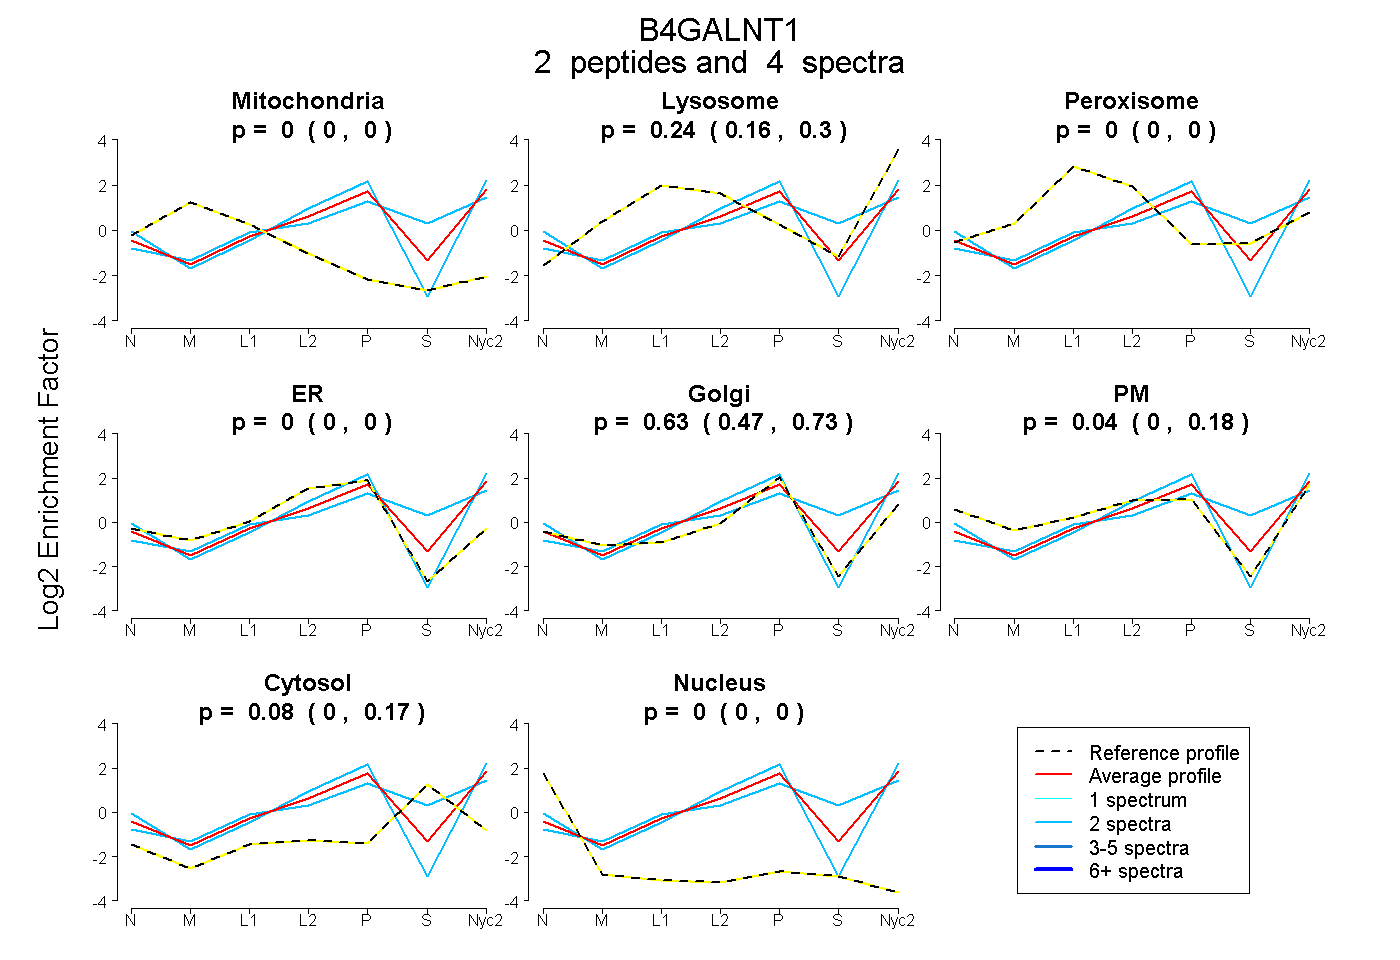
| Plot | Mito | Lyso | Perox | ER | Golgi | PM | Cytosol | Nucleus | |||||
| Expt A |
2 peptides |
4 spectra |
|
0.000 0.000 | 0.000 |
0.244 0.159 | 0.297 |
0.000 0.000 | 0.000 |
0.000 0.000 | 0.000 |
0.633 0.469 | 0.727 |
0.041 0.000 | 0.178 |
0.082 0.000 | 0.169 |
0.000 0.000 | 0.000 |
| 2 spectra, AFDAEELR | 0.000 | 0.334 | 0.000 | 0.000 | 0.335 | 0.000 | 0.331 | 0.000 | ||
| 2 spectra, SYQANTADTVR | 0.000 | 0.034 | 0.000 | 0.000 | 0.554 | 0.412 | 0.000 | 0.000 |
| Plot | Mito | Lyso or Perox | ER | Golgi | PM | Cytosol | Nucleus | ||||||
| Expt B |
1 peptide |
2 spectra |
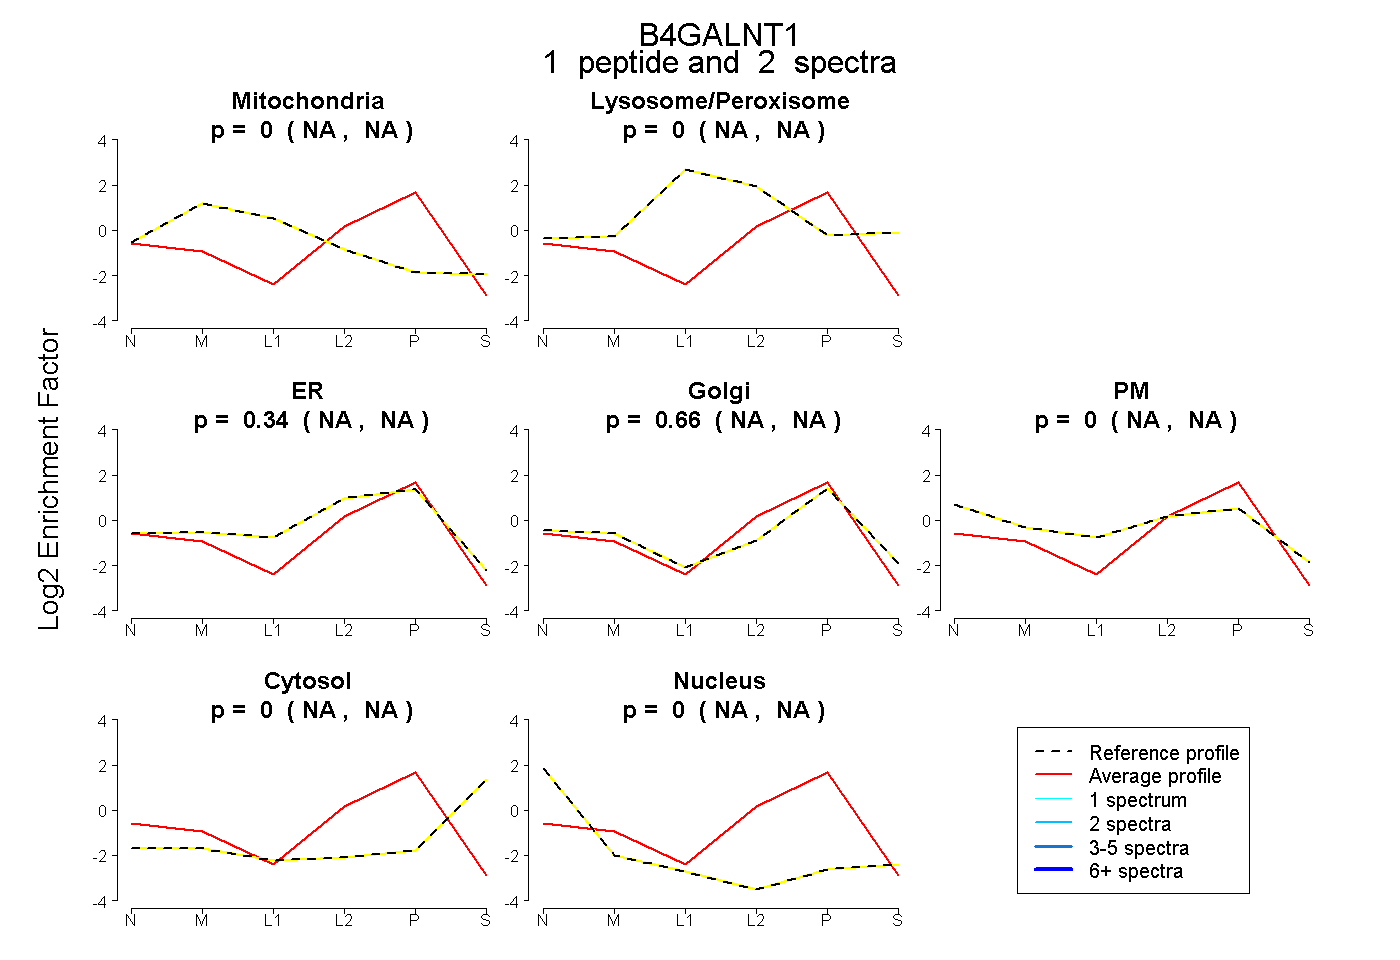 |
0.000 NA | NA |
0.000 NA | NA |
0.343 NA | NA |
0.657 NA | NA |
0.000 NA | NA |
0.000 NA | NA |
0.000 NA | NA |
|||
| Plot | Lyso | Other | |||||||||||
| Expt C |
10 peptides |
25 spectra |
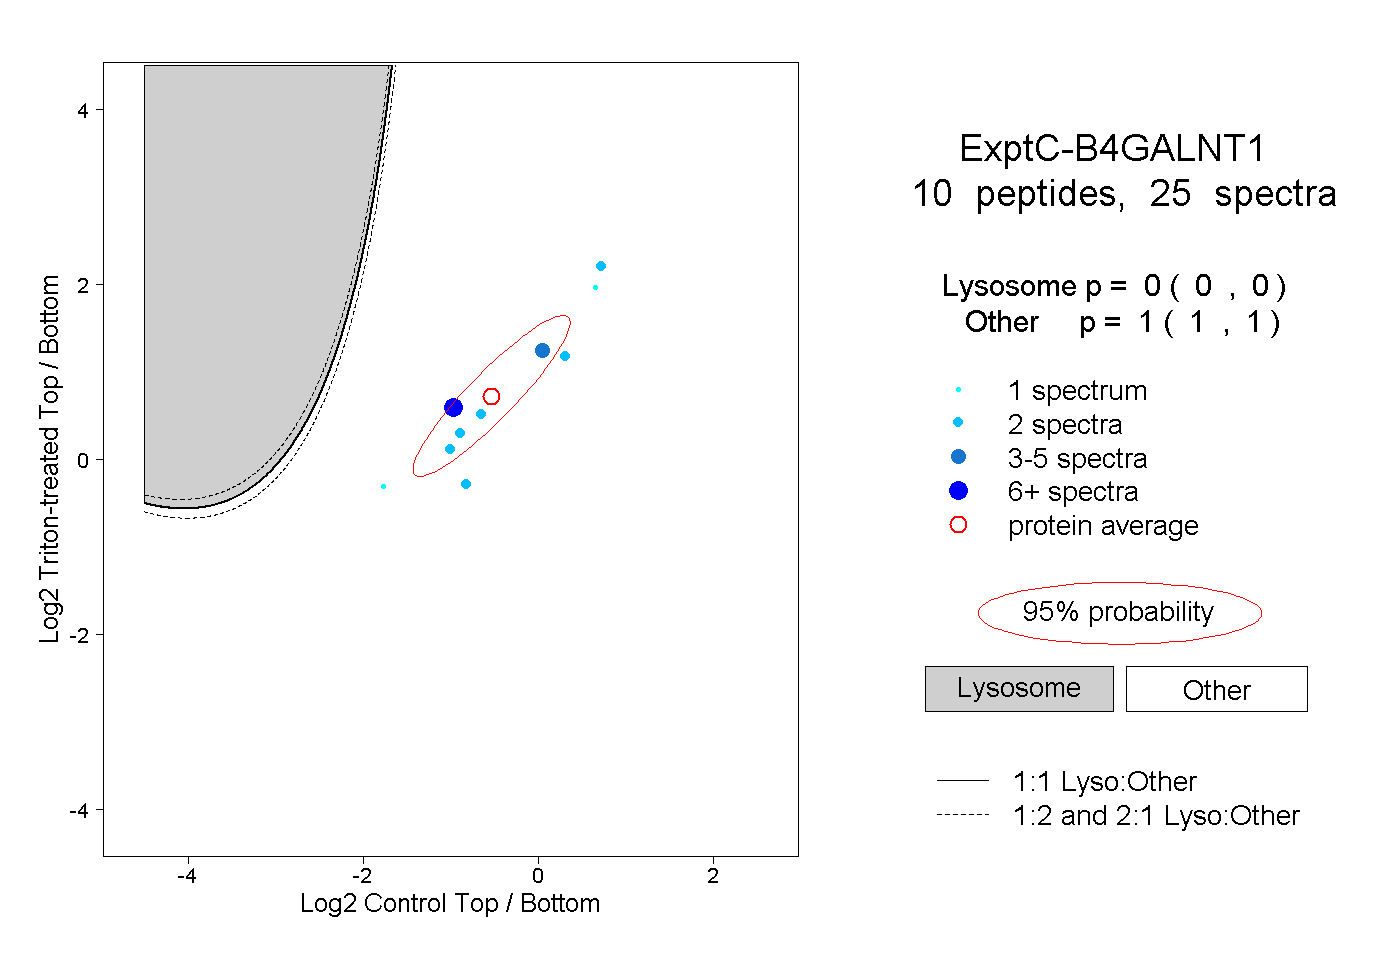 |
0.000 0.000 | 0.000 |
1.000 1.000 | 1.000 |