 7
7peptides
spectra
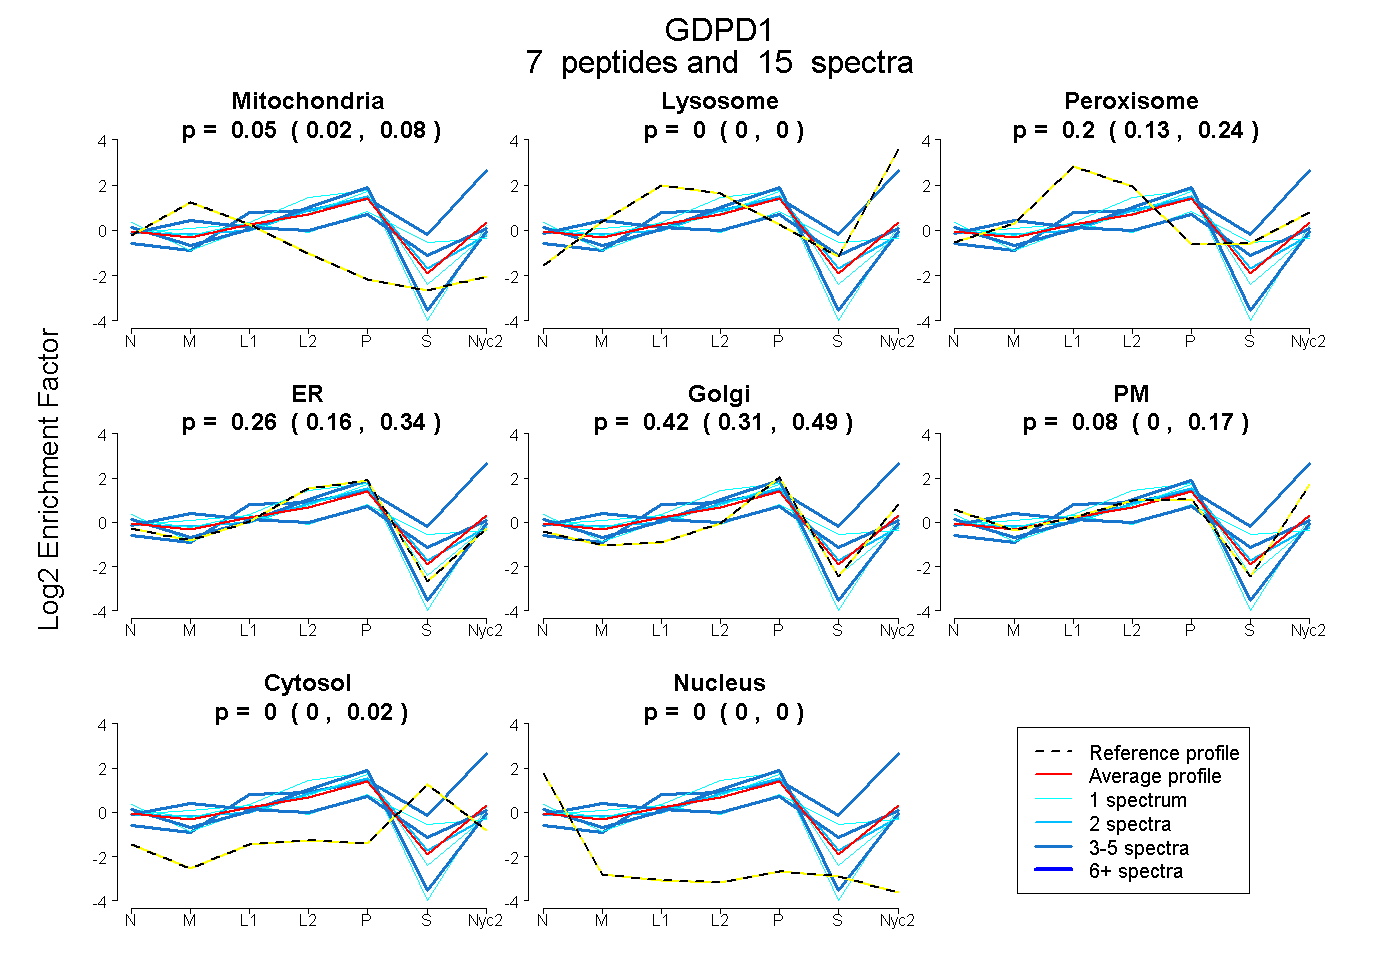
0.018 | 0.078
0.000 | 0.000
0.132 | 0.242
0.162 | 0.342
0.311 | 0.488
0.000 | 0.168
0.000 | 0.019
0.000 | 0.005
3peptides
spectra

0.000 | 0.000
0.339 | 0.439
0.000 | 0.065
0.277 | 0.551
0.000 | 0.287
0.000 | 0.067
0.000 | 0.000
2peptides
spectra
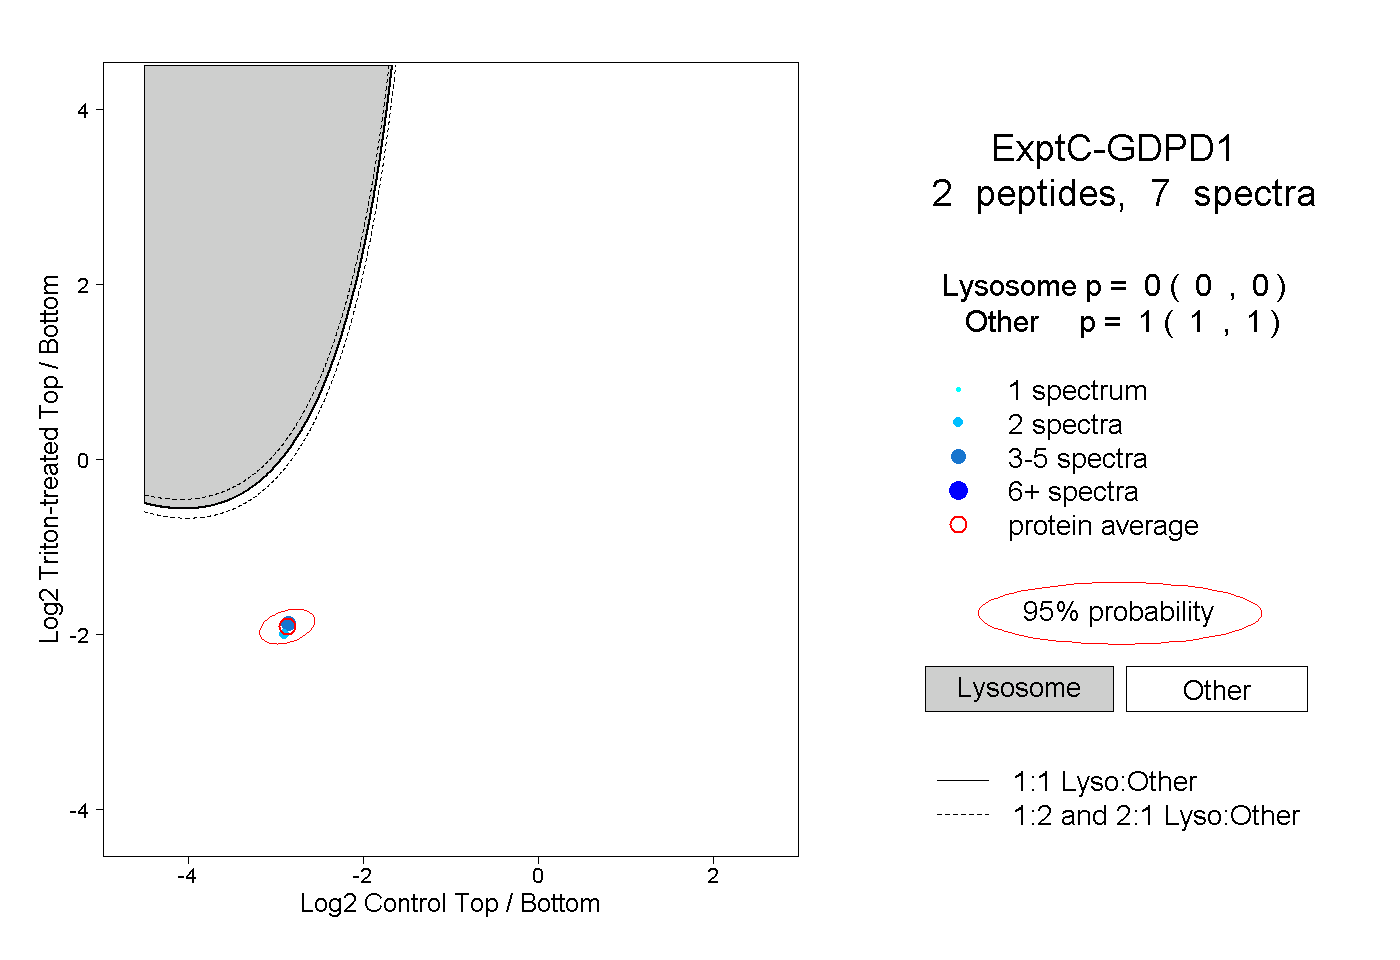
0.000 | 0.000
1.000 | 1.000
3peptides
spectra
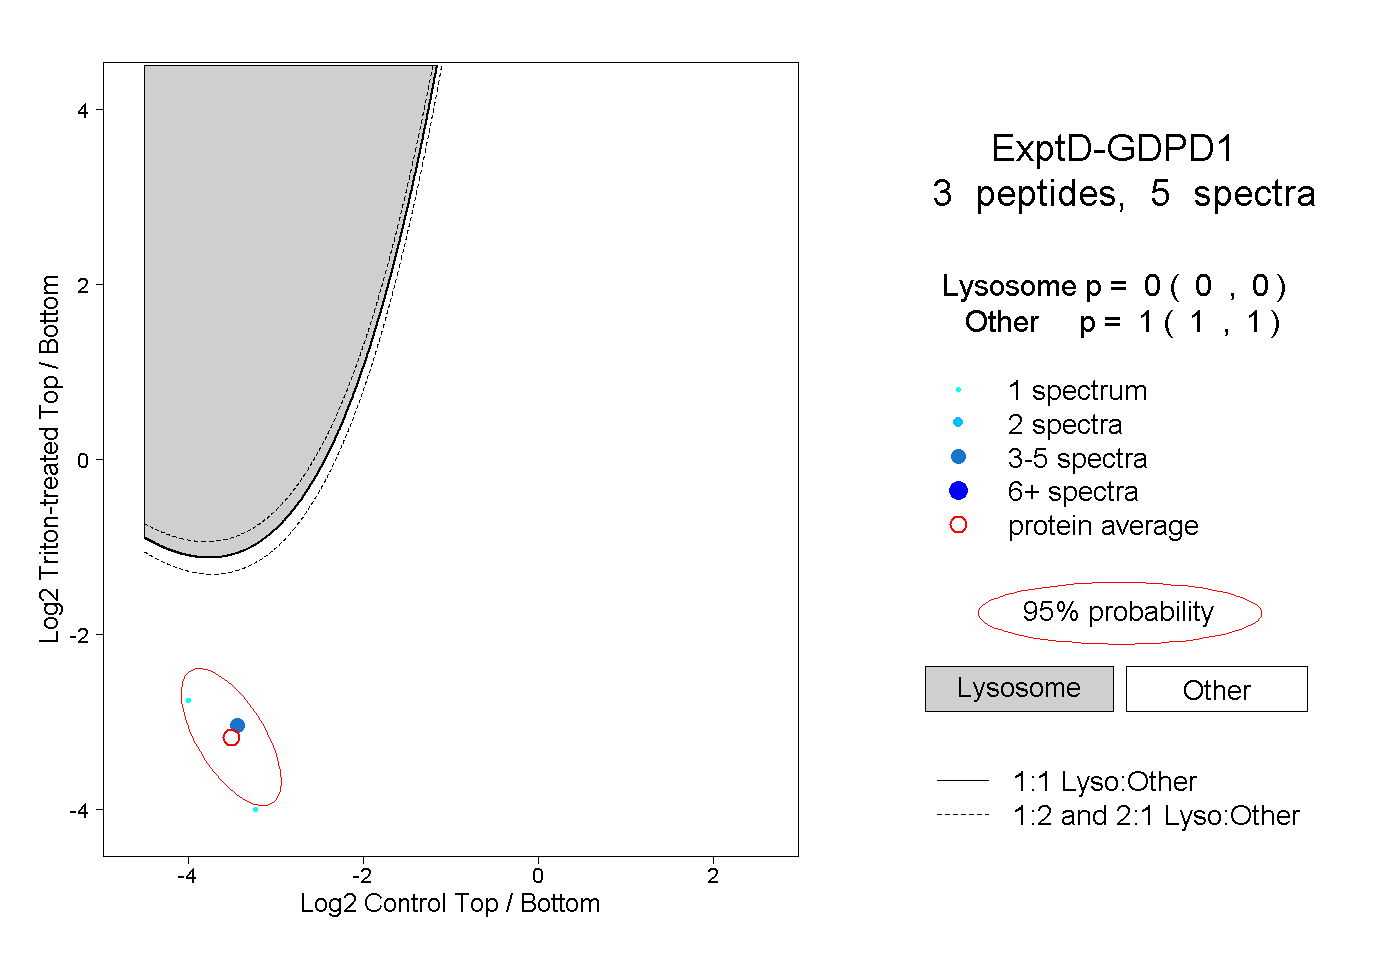
0.000 | 0.000
1.000 | 1.000