 7
7peptides
spectra
0.018 | 0.078
0.000 | 0.000
0.132 | 0.242
0.162 | 0.342
0.311 | 0.488
0.000 | 0.168
0.000 | 0.019
0.000 | 0.005
| Plot | Mito | Lyso | Perox | ER | Golgi | PM | Cytosol | Nucleus | |||||
| Expt A |
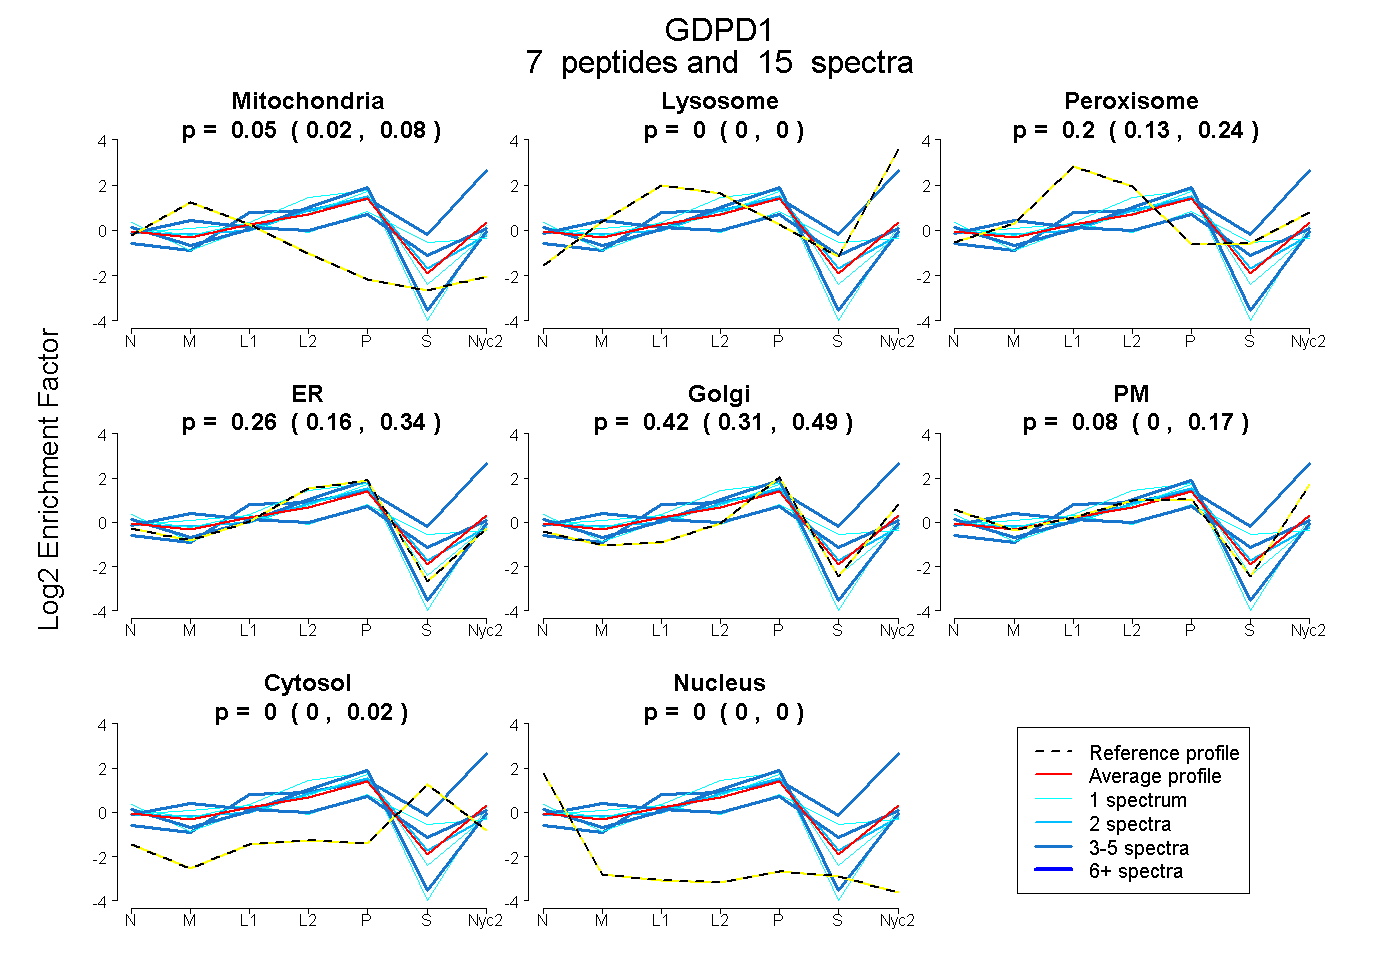
7 peptides |
15 spectra |
|
0.053 0.018 | 0.078 |
0.000 0.000 | 0.000 |
0.196 0.132 | 0.242 |
0.258 0.162 | 0.342 |
0.415 0.311 | 0.488 |
0.077 0.000 | 0.168 |
0.000 0.000 | 0.019 |
0.000 0.000 | 0.005 |
| 1 spectrum, VNNNVLIQK | 0.019 | 0.000 | 0.000 | 0.733 | 0.000 | 0.248 | 0.000 | 0.000 | ||
| 3 spectra, ALFDHLTAR | 0.000 | 0.586 | 0.000 | 0.000 | 0.282 | 0.001 | 0.131 | 0.000 | ||
| 1 spectrum, YCELPPYLCK | 0.148 | 0.000 | 0.284 | 0.012 | 0.393 | 0.000 | 0.164 | 0.000 | ||
| 1 spectrum, STGVNVNVSDLK | 0.000 | 0.000 | 0.020 | 0.633 | 0.109 | 0.169 | 0.000 | 0.069 | ||
| 2 spectra, LDVPFQR | 0.075 | 0.000 | 0.120 | 0.533 | 0.226 | 0.000 | 0.046 | 0.000 | ||
| 3 spectra, VSELVK | 0.000 | 0.000 | 0.000 | 0.772 | 0.054 | 0.143 | 0.000 | 0.031 | ||
| 4 spectra, YPALLHQR | 0.200 | 0.000 | 0.268 | 0.000 | 0.476 | 0.000 | 0.056 | 0.000 |
| Plot | Mito | Lyso or Perox | ER | Golgi | PM | Cytosol | Nucleus | ||||||
| Expt B |
3 peptides |
3 spectra |
 |
0.000 0.000 | 0.000 |
0.421 0.339 | 0.439 |
0.000 0.000 | 0.065 |
0.495 0.277 | 0.551 |
0.052 0.000 | 0.287 |
0.032 0.000 | 0.067 |
0.000 0.000 | 0.000 |
|||
| Plot | Lyso | Other | |||||||||||
| Expt C |
2 peptides |
7 spectra |
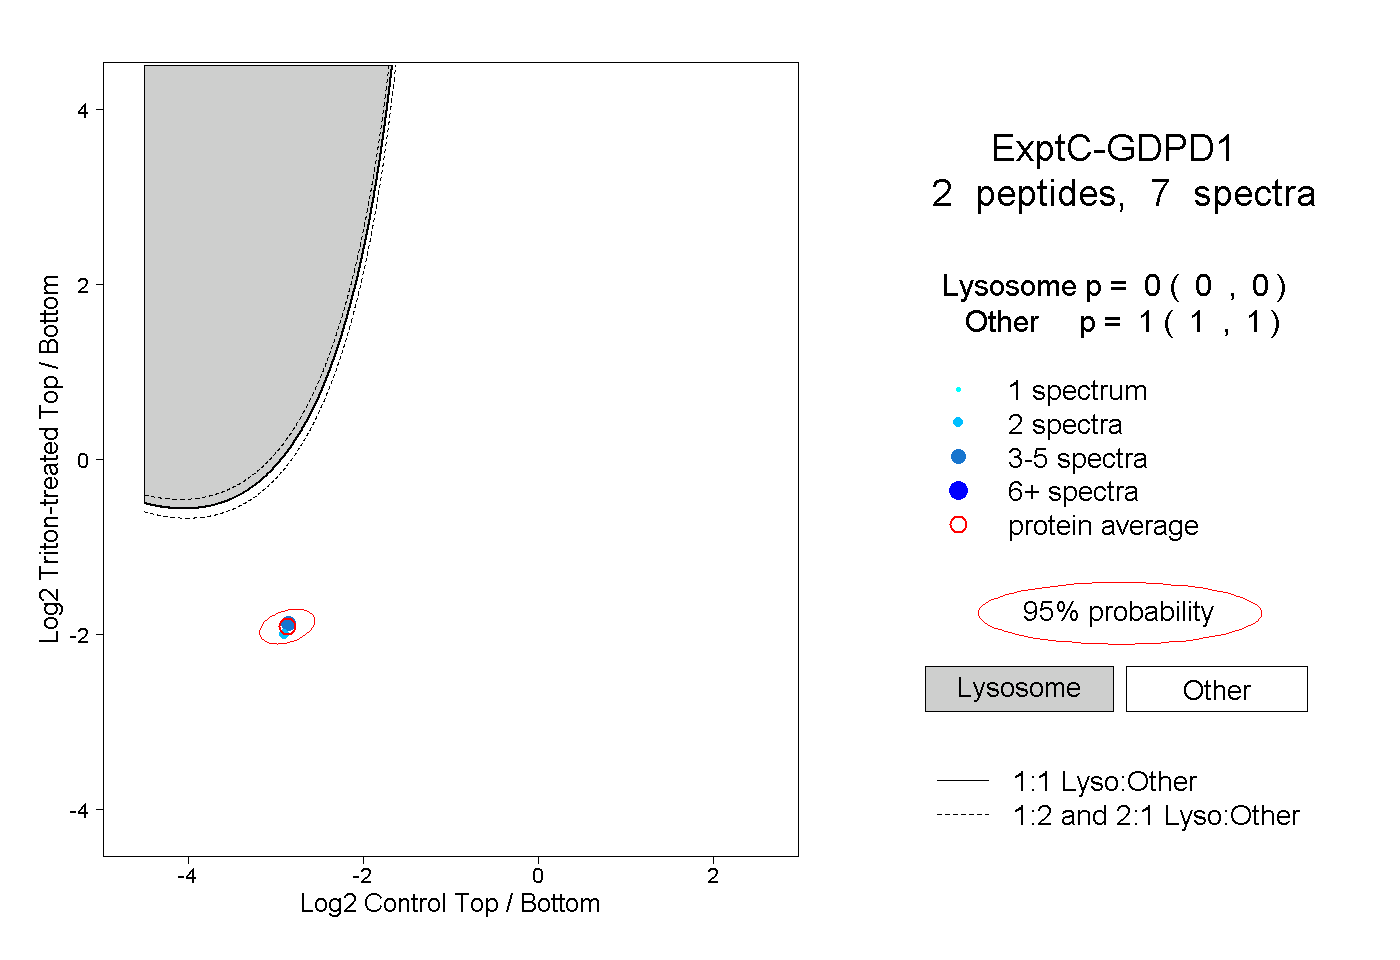 |
0.000 0.000 | 0.000 |
1.000 1.000 | 1.000 |
||||||||
| Plot | Lyso | Other | |||||||||||
| Expt D |
3 peptides |
5 spectra |
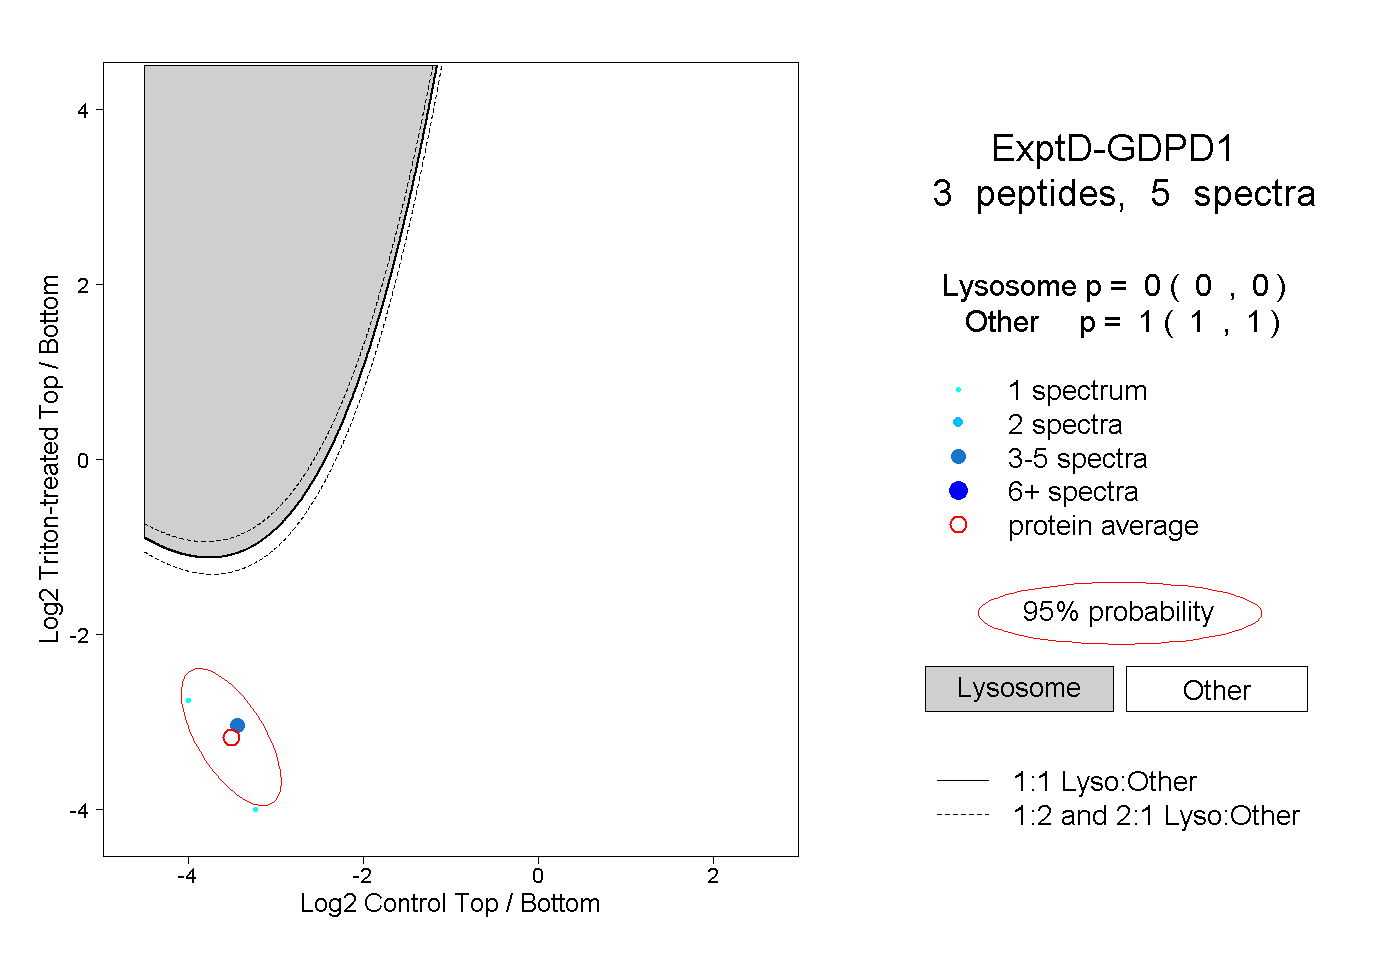 |
0.000 0.000 | 0.000 |
1.000 1.000 | 1.000 |