 5
5peptides
spectra
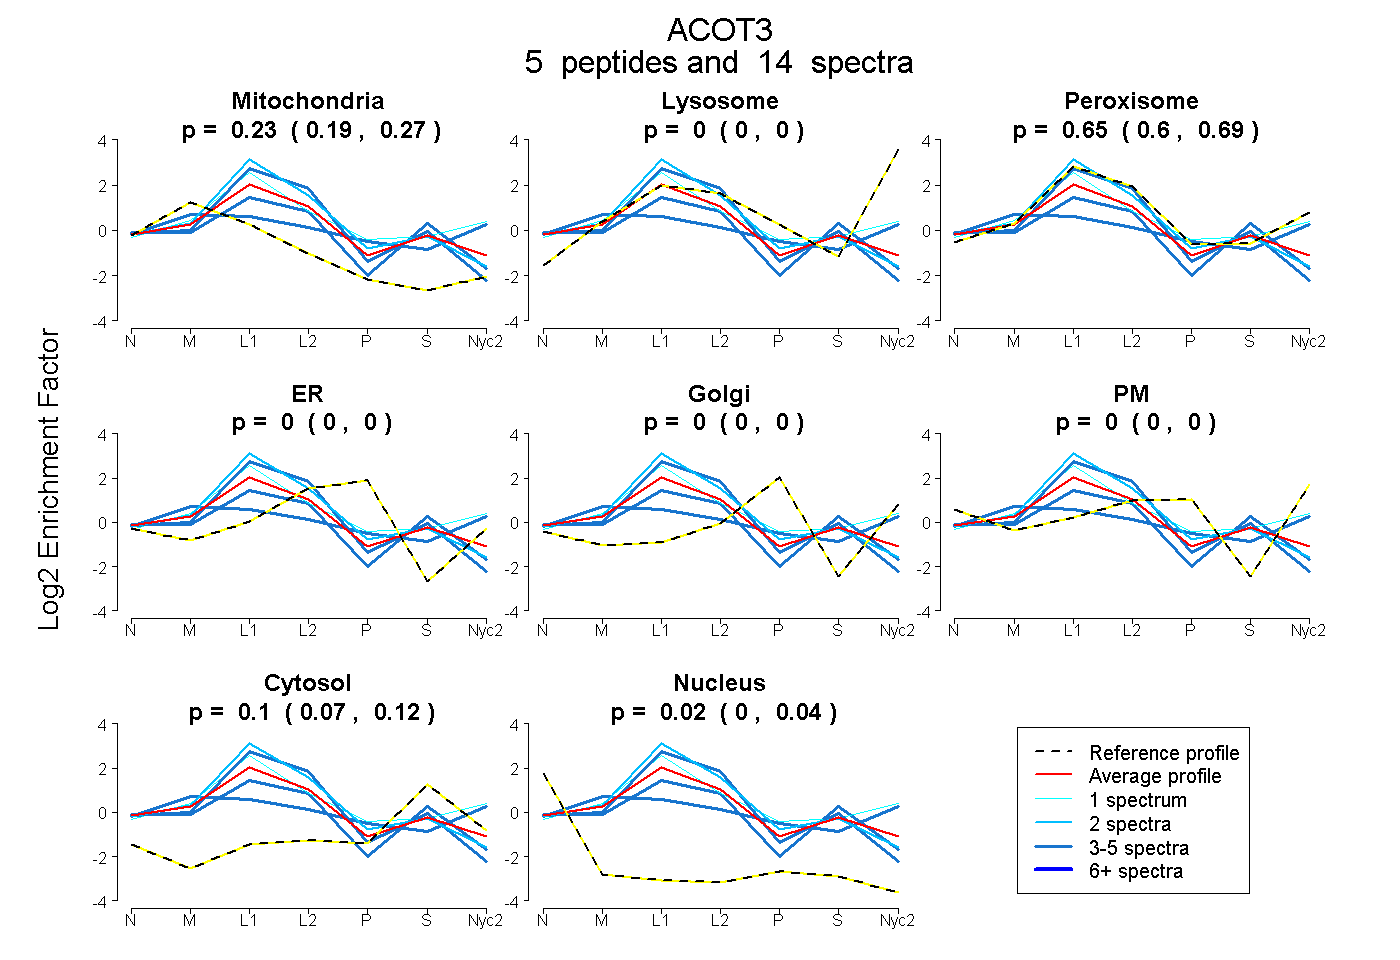
0.187 | 0.265
0.000 | 0.000
0.603 | 0.690
0.000 | 0.000
0.000 | 0.000
0.000 | 0.000
0.069 | 0.124
0.003 | 0.039
2peptides
spectra
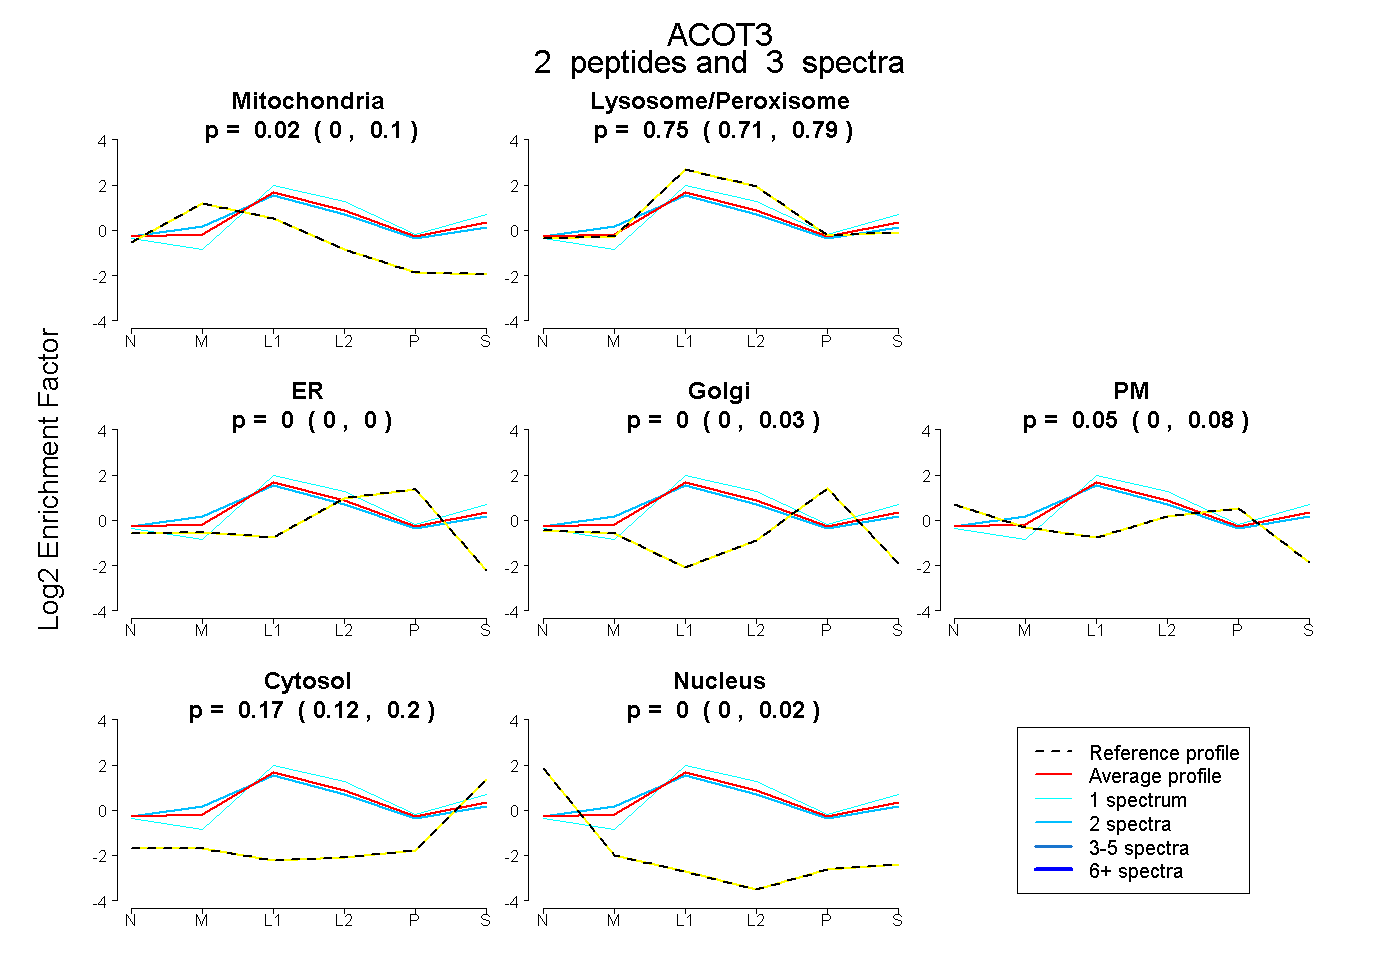
0.000 | 0.099
0.706 | 0.794
0.000 | 0.000
0.000 | 0.035
0.000 | 0.078
0.119 | 0.203
0.000 | 0.015
10peptides
spectra
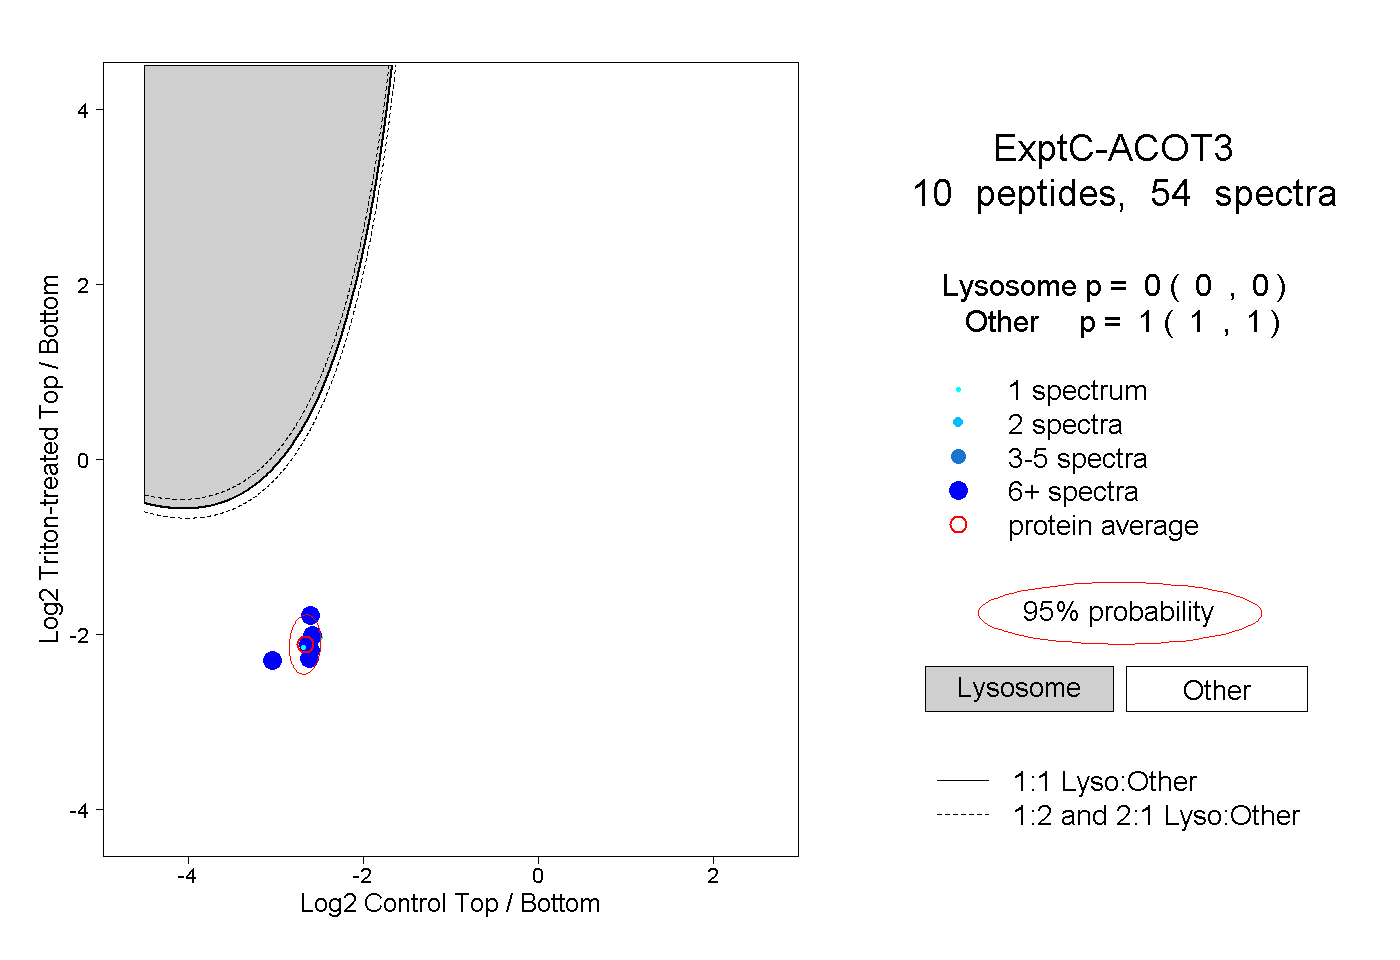
0.000 | 0.000
1.000 | 1.000
4peptides
spectra
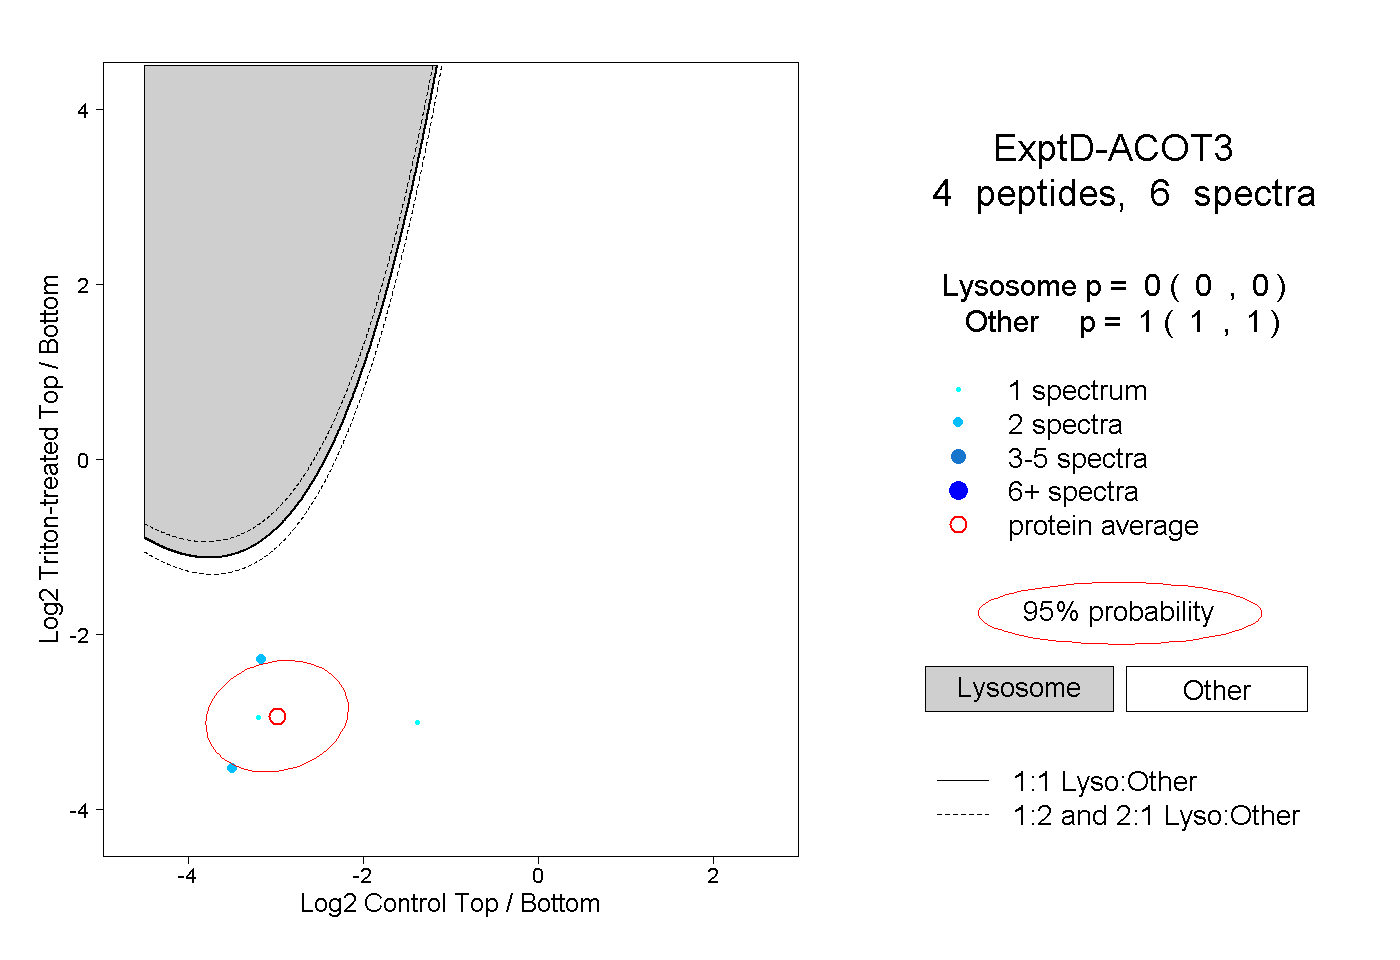
0.000 | 0.000
1.000 | 1.000