 5
5peptides
spectra
0.187 | 0.265
0.000 | 0.000
0.603 | 0.690
0.000 | 0.000
0.000 | 0.000
0.000 | 0.000
0.069 | 0.124
0.003 | 0.039
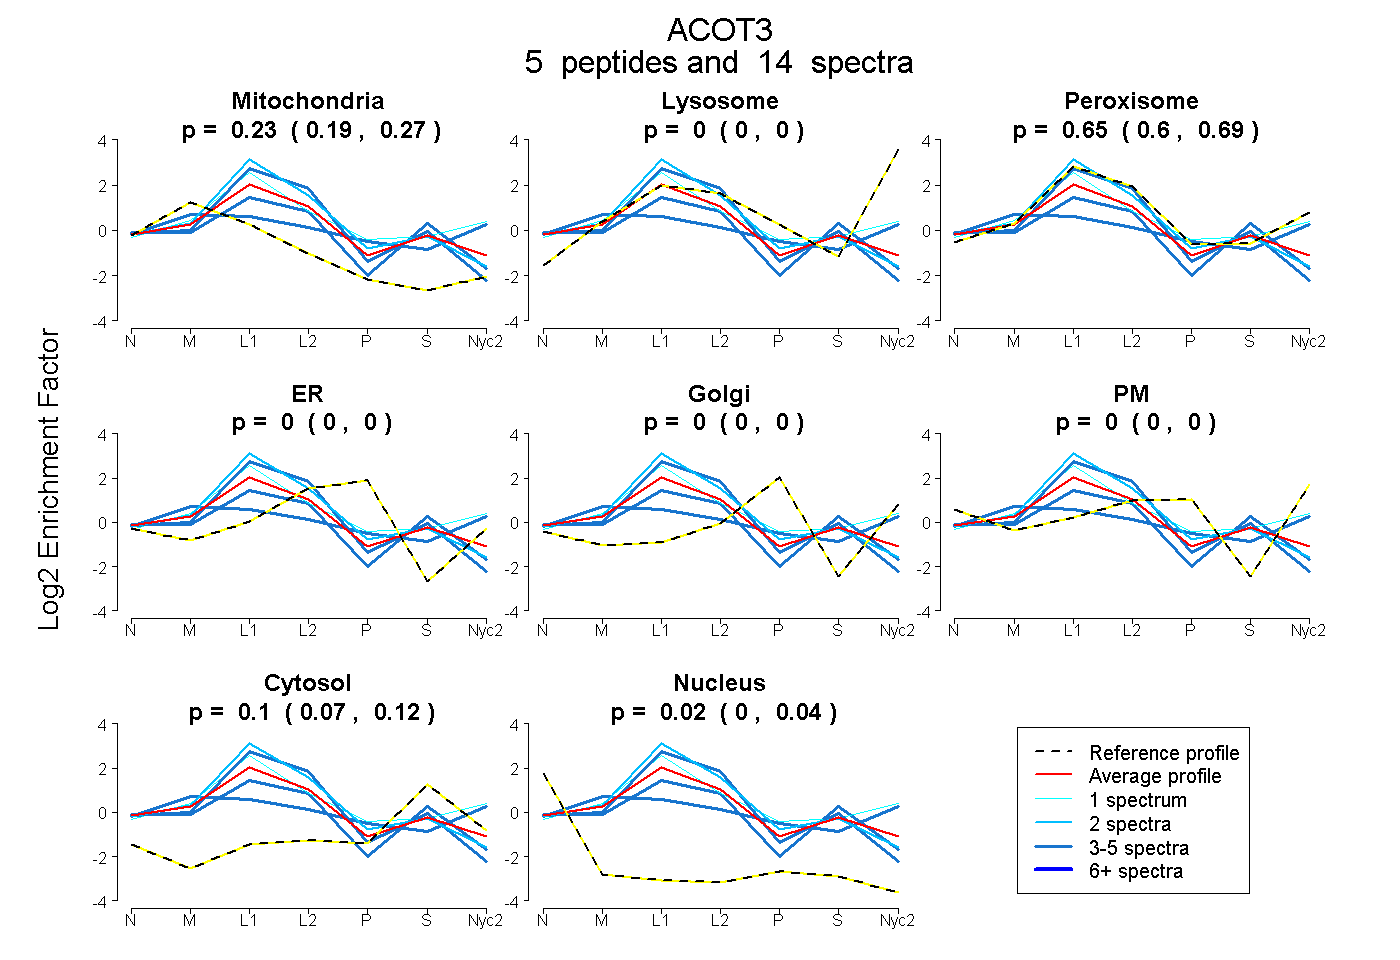
| Plot | Mito | Lyso | Perox | ER | Golgi | PM | Cytosol | Nucleus | |||||
| Expt A |
5 peptides |
14 spectra |
|
0.229 0.187 | 0.265 |
0.000 0.000 | 0.000 |
0.650 0.603 | 0.690 |
0.000 0.000 | 0.000 |
0.000 0.000 | 0.000 |
0.000 0.000 | 0.000 |
0.100 0.069 | 0.124 |
0.022 0.003 | 0.039 |
| 2 spectra, SIIPVER | 0.205 | 0.000 | 0.785 | 0.000 | 0.000 | 0.000 | 0.000 | 0.011 | ||
| 4 spectra, ASLHSLVGGPVIWGGEPR | 0.314 | 0.130 | 0.214 | 0.000 | 0.000 | 0.199 | 0.144 | 0.000 | ||
| 4 spectra, GGELGFAMATFLK | 0.161 | 0.000 | 0.756 | 0.000 | 0.000 | 0.000 | 0.004 | 0.079 | ||
| 3 spectra, ADAHGVLDLER | 0.263 | 0.000 | 0.475 | 0.000 | 0.000 | 0.000 | 0.239 | 0.023 | ||
| 1 spectrum, DETILPVGMSTK | 0.086 | 0.000 | 0.833 | 0.000 | 0.005 | 0.000 | 0.076 | 0.000 |
| Plot | Mito | Lyso or Perox | ER | Golgi | PM | Cytosol | Nucleus | ||||||
| Expt B |
2 peptides |
3 spectra |
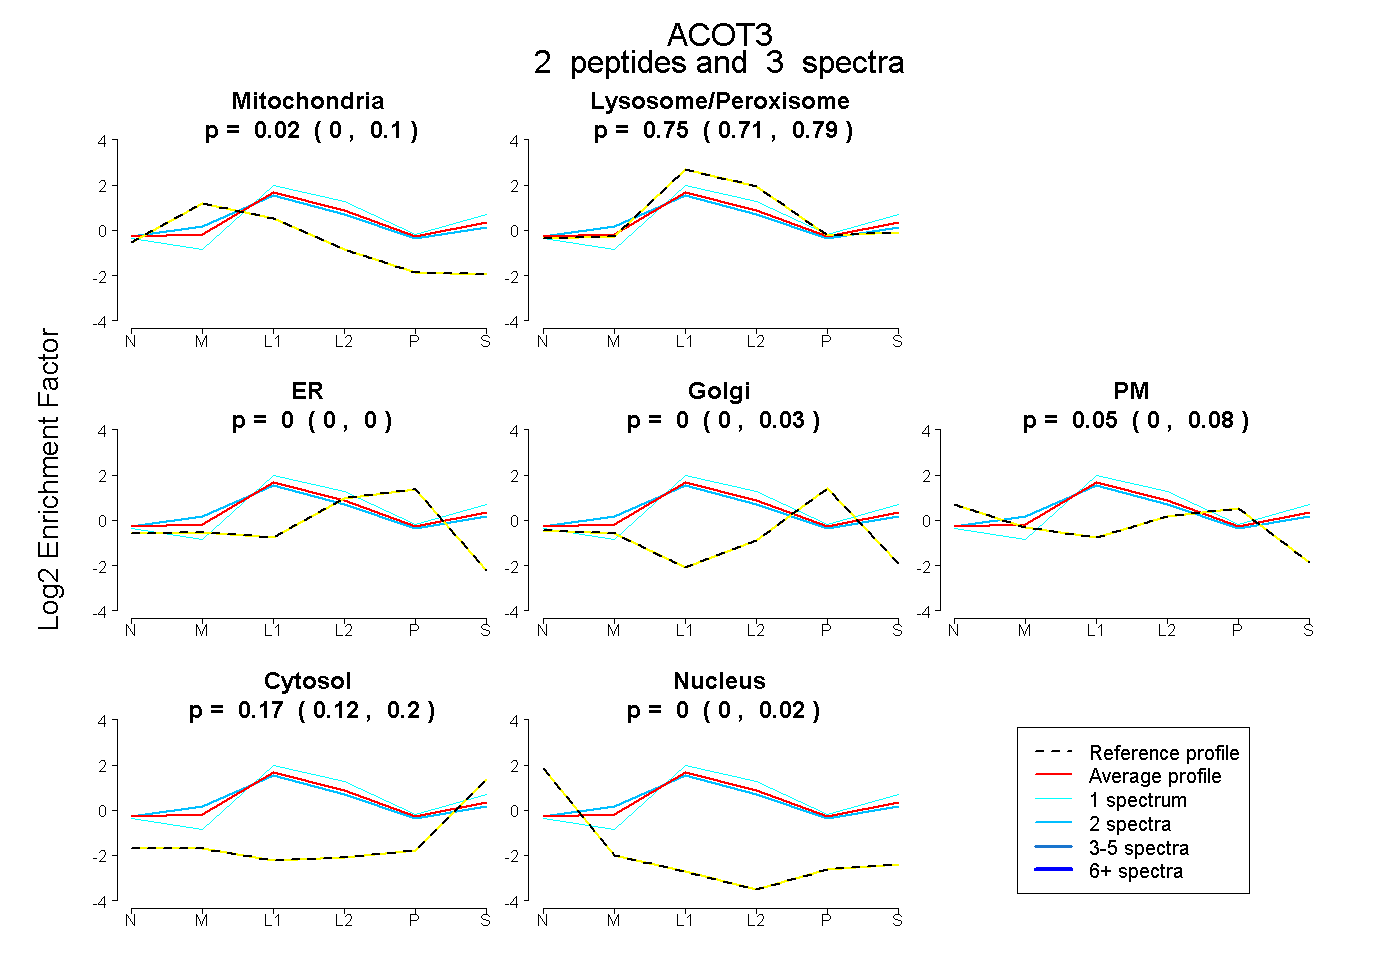 |
0.023 0.000 | 0.099 |
0.755 0.706 | 0.794 |
0.000 0.000 | 0.000 |
0.000 0.000 | 0.035 |
0.051 0.000 | 0.078 |
0.171 0.119 | 0.203 |
0.000 0.000 | 0.015 |
|||
| Plot | Lyso | Other | |||||||||||
| Expt C |
10 peptides |
54 spectra |
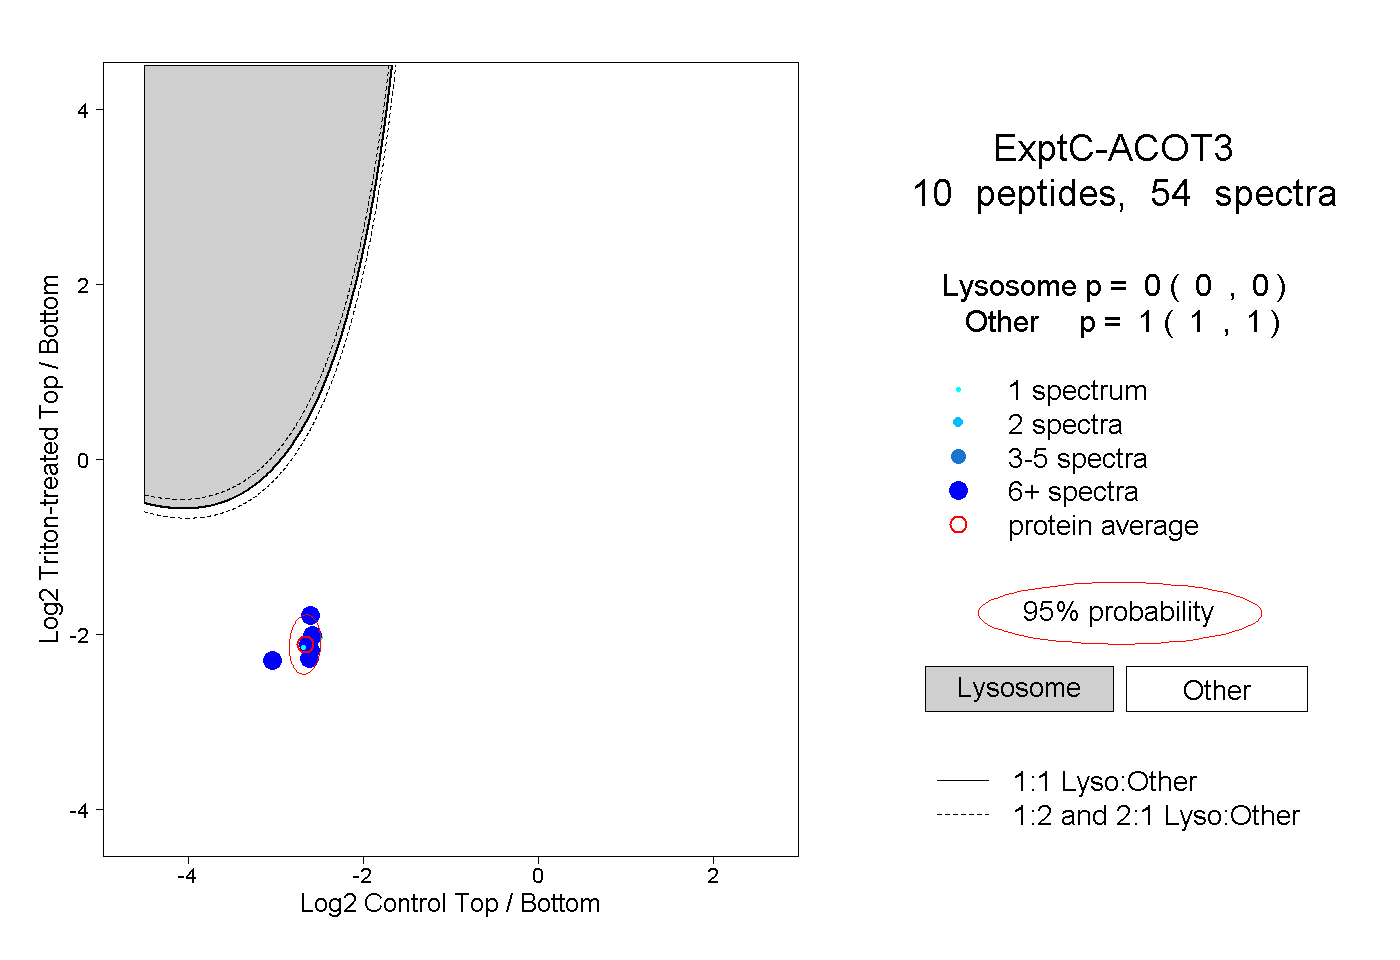 |
0.000 0.000 | 0.000 |
1.000 1.000 | 1.000 |
||||||||
| Plot | Lyso | Other | |||||||||||
| Expt D |
4 peptides |
6 spectra |
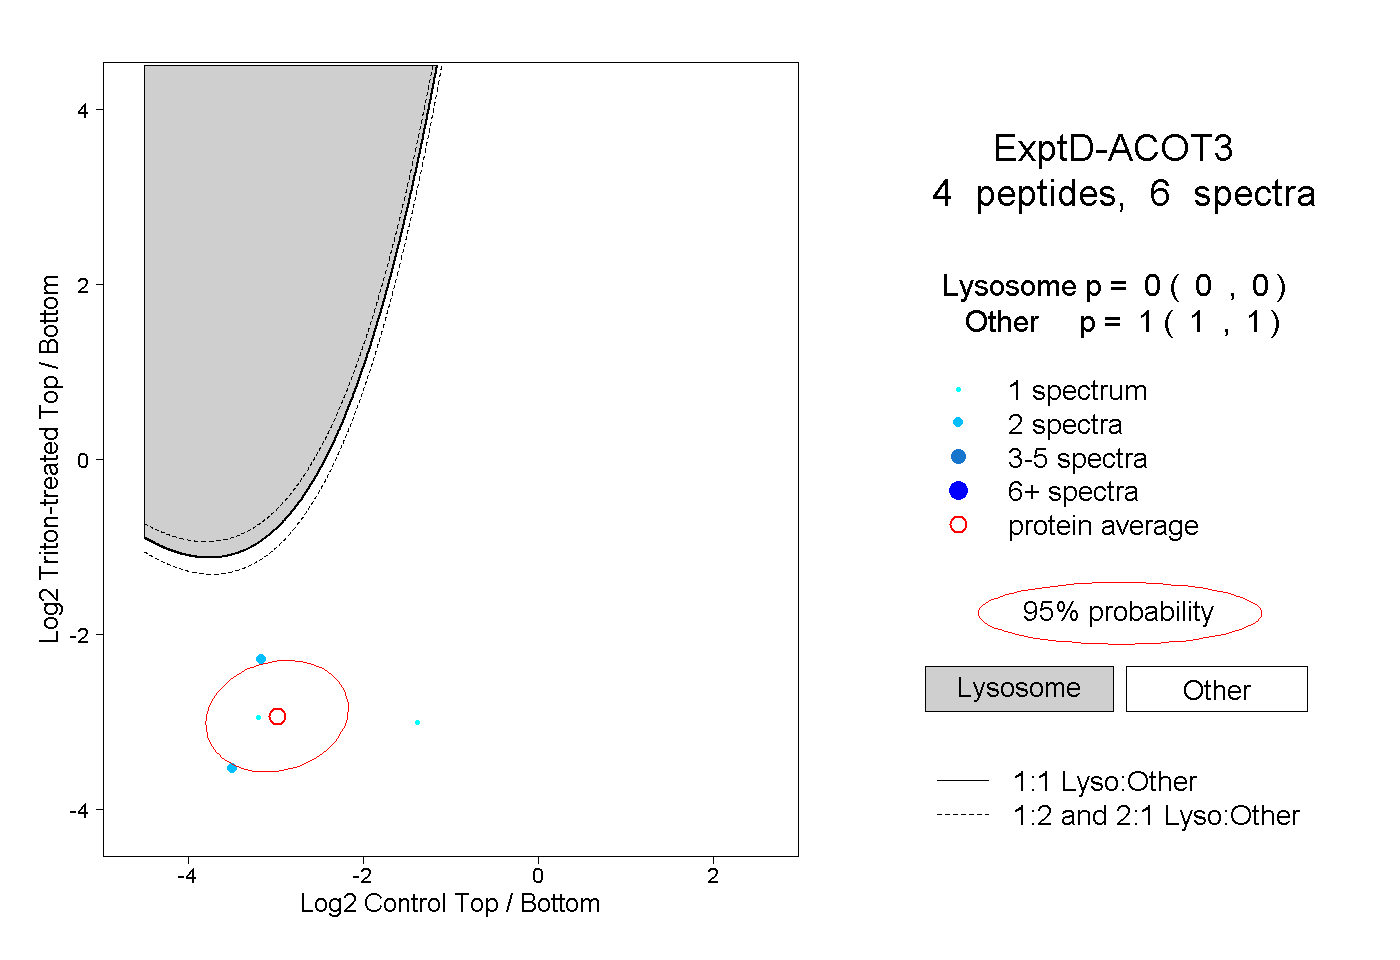 |
0.000 0.000 | 0.000 |
1.000 1.000 | 1.000 |