 9
9peptides
spectra
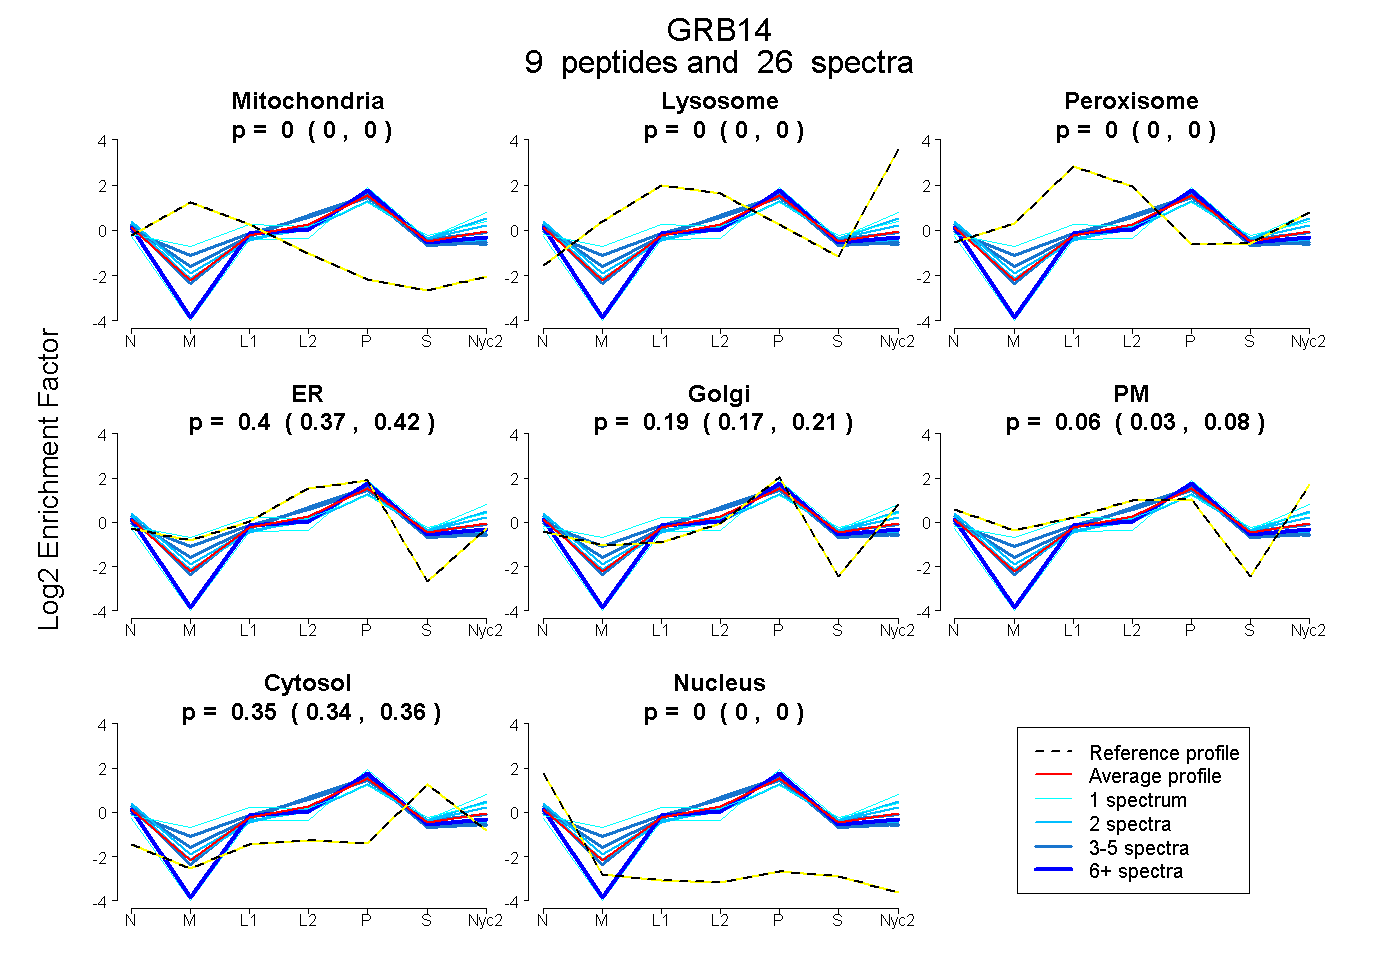
0.000 | 0.000
0.000 | 0.000
0.000 | 0.000
0.370 | 0.418
0.173 | 0.211
0.034 | 0.083
0.341 | 0.356
0.000 | 0.000
4peptides
spectra
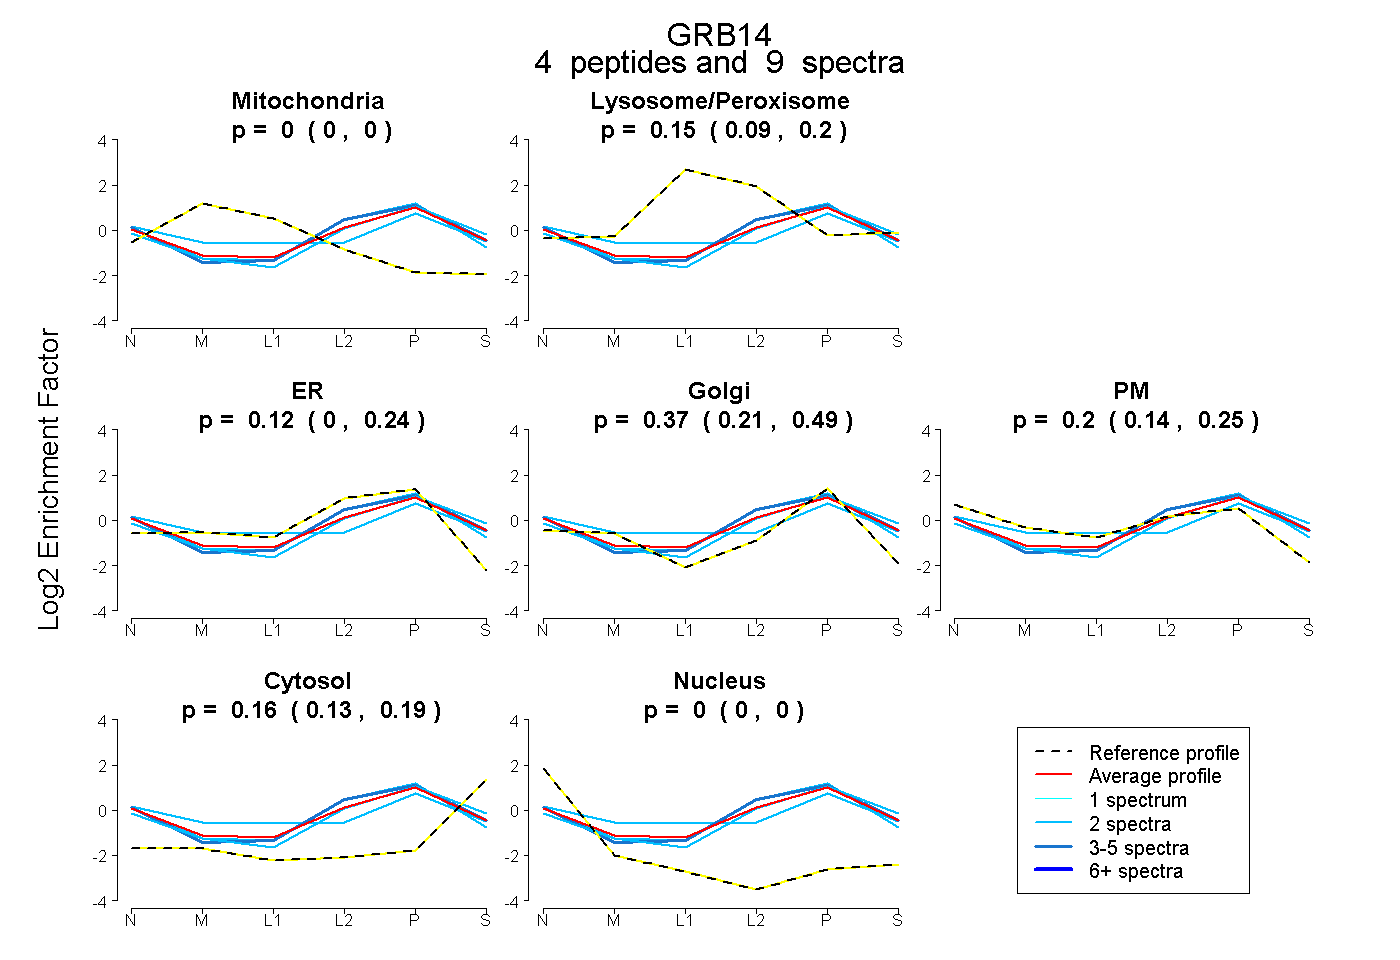
0.000 | 0.000
0.085 | 0.203
0.000 | 0.241
0.207 | 0.491
0.143 | 0.245
0.127 | 0.190
0.000 | 0.000
7peptides
spectra
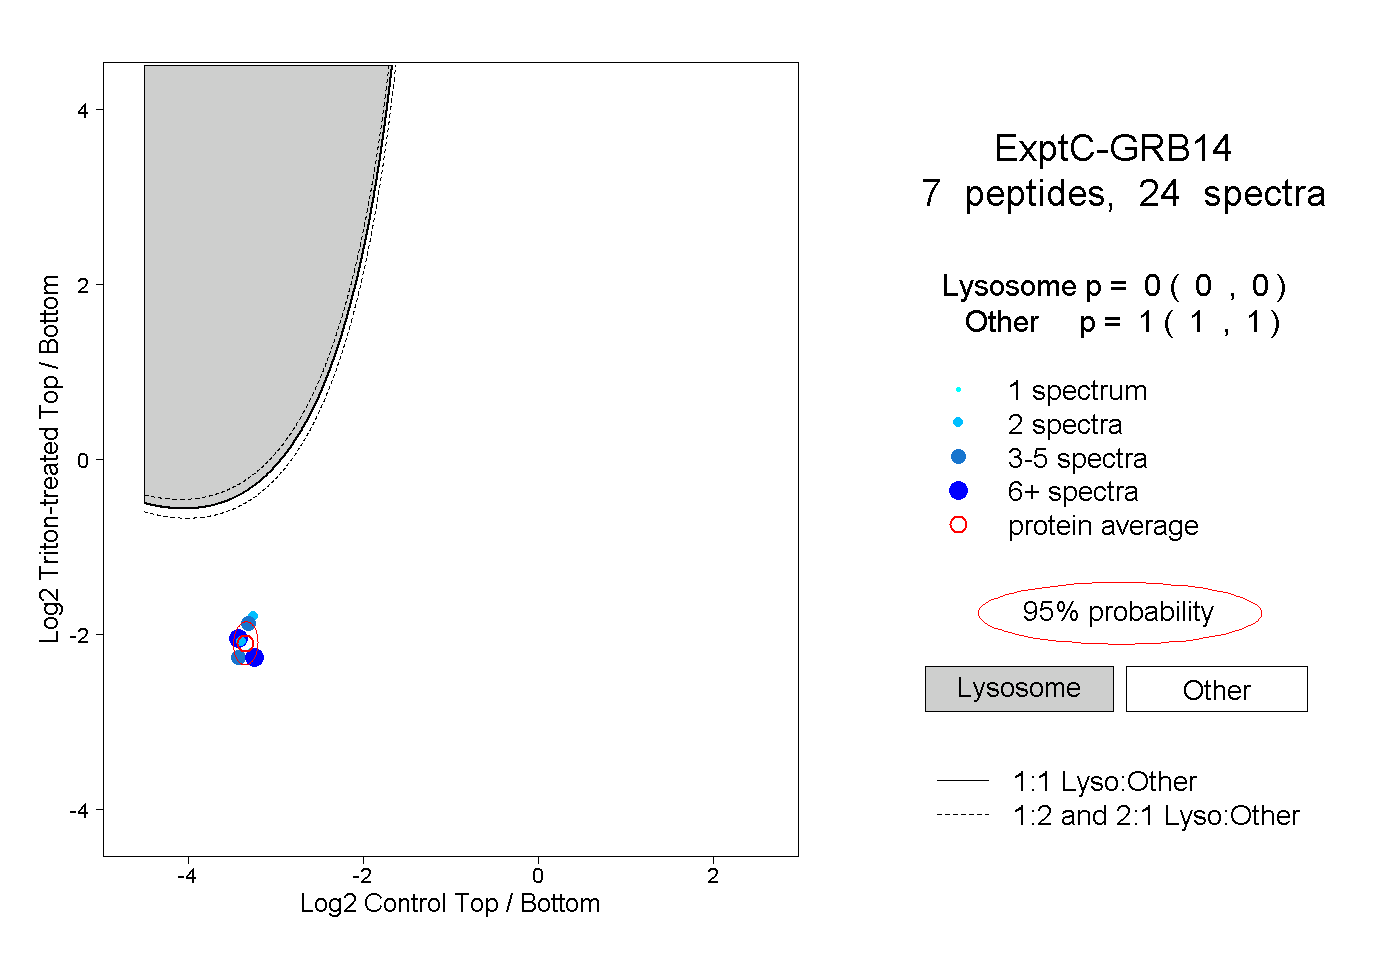
0.000 | 0.000
1.000 | 1.000
3peptides
spectra
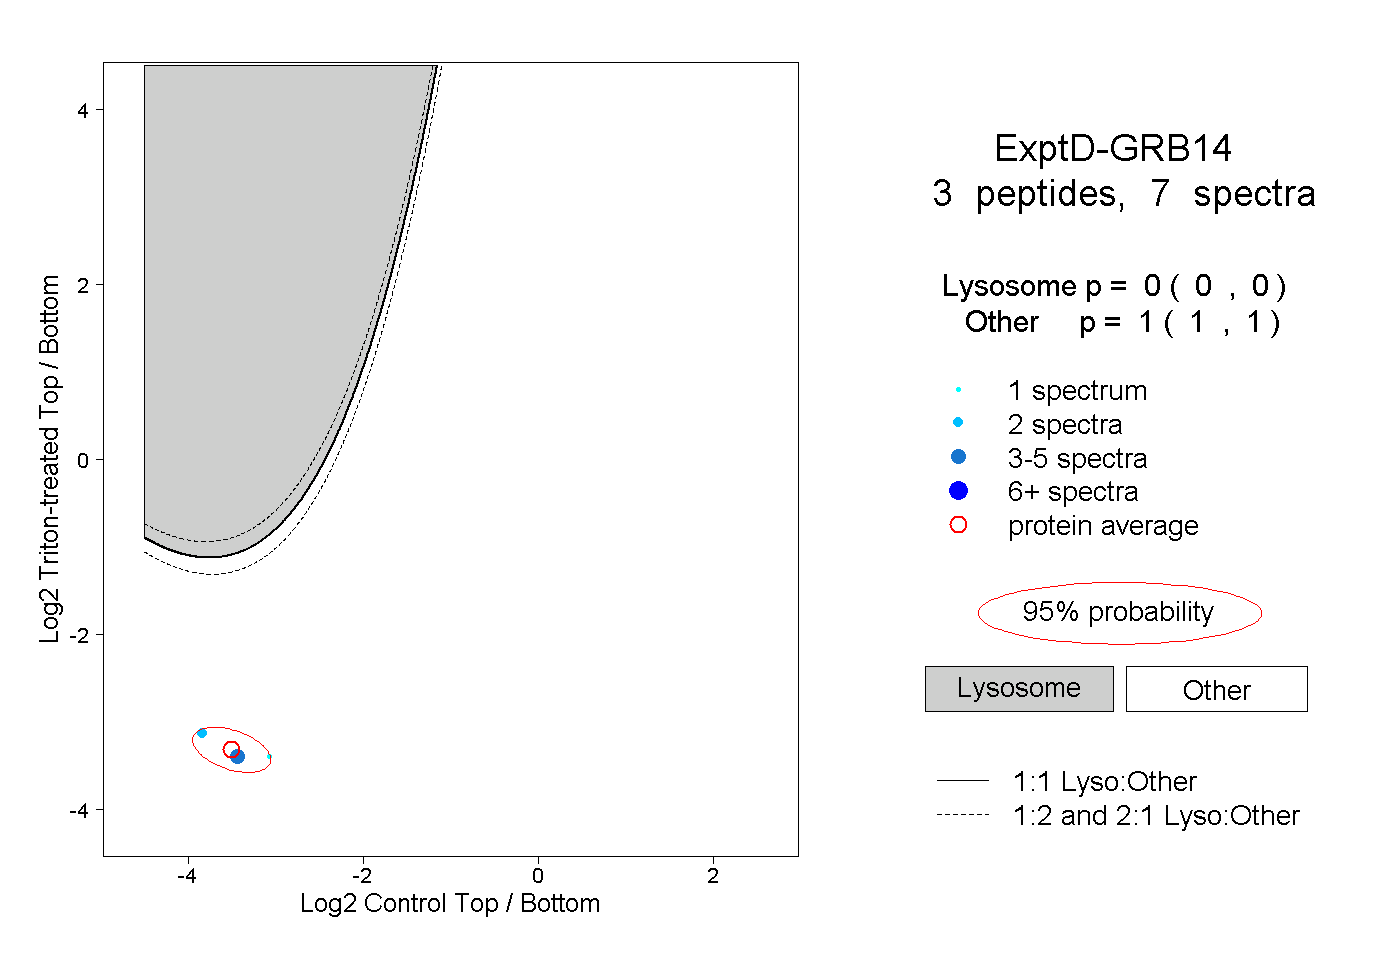
0.000 | 0.000
1.000 | 1.000