 9
9peptides
spectra
0.000 | 0.000
0.000 | 0.000
0.000 | 0.000
0.370 | 0.418
0.173 | 0.211
0.034 | 0.083
0.341 | 0.356
0.000 | 0.000
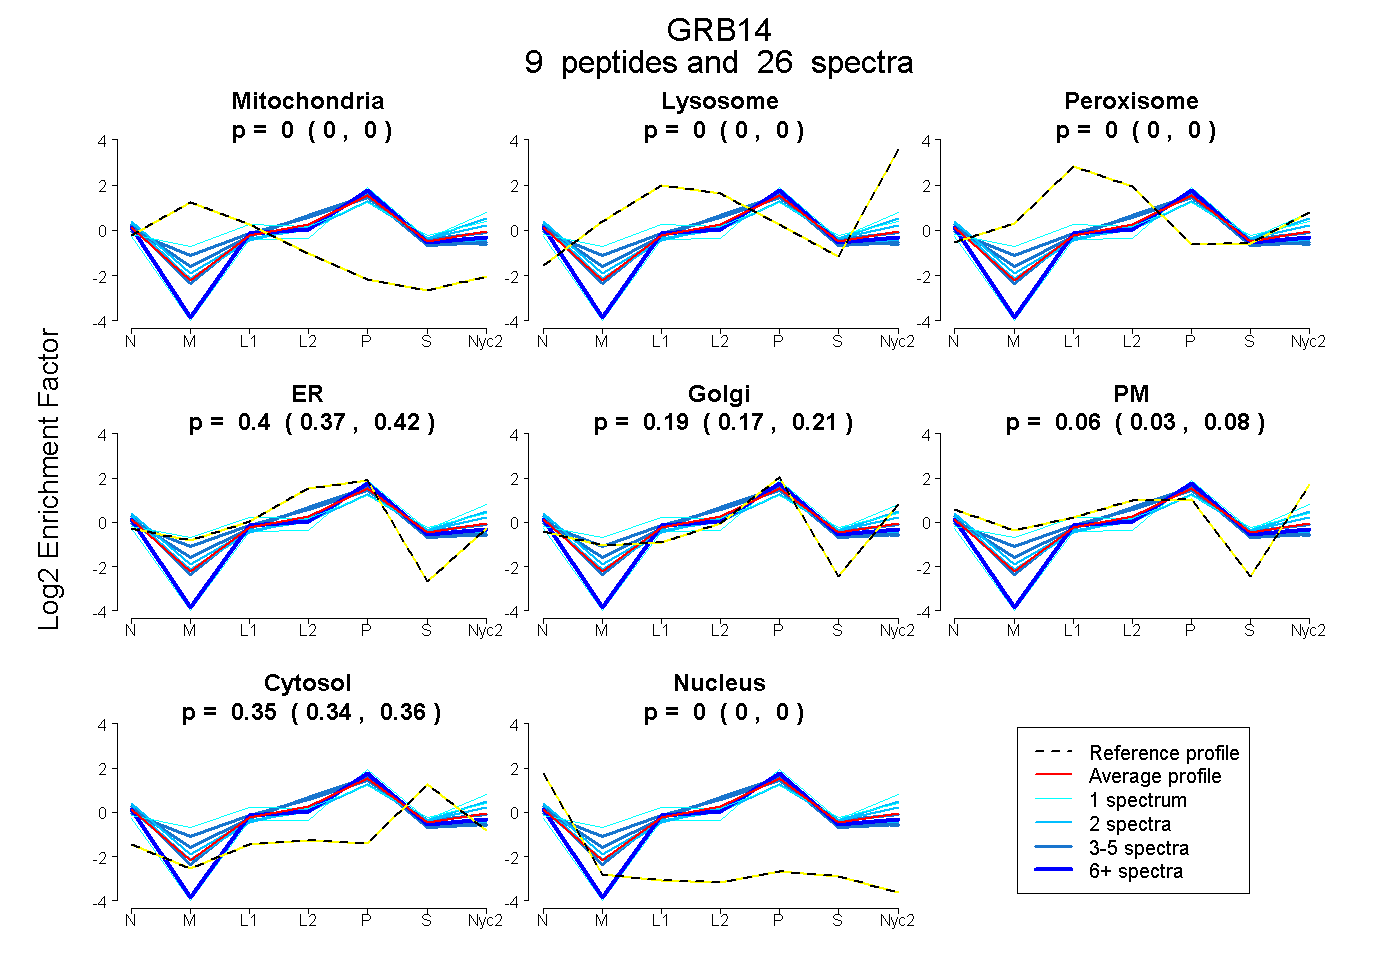
| Plot | Mito | Lyso | Perox | ER | Golgi | PM | Cytosol | Nucleus | |||||
| Expt A |
9 peptides |
26 spectra |
|
0.000 0.000 | 0.000 |
0.000 0.000 | 0.000 |
0.000 0.000 | 0.000 |
0.396 0.370 | 0.418 |
0.193 0.173 | 0.211 |
0.061 0.034 | 0.083 |
0.349 0.341 | 0.356 |
0.000 0.000 | 0.000 |
| 6 spectra, SACSSQSVSPMR | 0.000 | 0.000 | 0.000 | 0.361 | 0.236 | 0.000 | 0.403 | 0.000 | ||
| 1 spectrum, AGAQDSPLAVQVCR | 0.000 | 0.000 | 0.000 | 0.000 | 0.622 | 0.000 | 0.378 | 0.000 | ||
| 4 spectra, ALEVPSDVTAR | 0.000 | 0.000 | 0.000 | 0.508 | 0.034 | 0.097 | 0.361 | 0.000 | ||
| 1 spectrum, TFVLSMSHGQK | 0.000 | 0.000 | 0.310 | 0.000 | 0.483 | 0.000 | 0.207 | 0.000 | ||
| 2 spectra, QGPVDGVFLVR | 0.000 | 0.000 | 0.000 | 0.177 | 0.186 | 0.270 | 0.367 | 0.000 | ||
| 4 spectra, MLCAEEDQSR | 0.000 | 0.000 | 0.000 | 0.685 | 0.000 | 0.000 | 0.315 | 0.000 | ||
| 2 spectra, AYFFLR | 0.000 | 0.000 | 0.000 | 0.477 | 0.169 | 0.000 | 0.354 | 0.000 | ||
| 2 spectra, DEAQQLITR | 0.000 | 0.000 | 0.000 | 0.128 | 0.358 | 0.184 | 0.329 | 0.000 | ||
| 4 spectra, MCWVTAIR | 0.000 | 0.000 | 0.063 | 0.616 | 0.000 | 0.000 | 0.322 | 0.000 |
| Plot | Mito | Lyso or Perox | ER | Golgi | PM | Cytosol | Nucleus | ||||||
| Expt B |
4 peptides |
9 spectra |
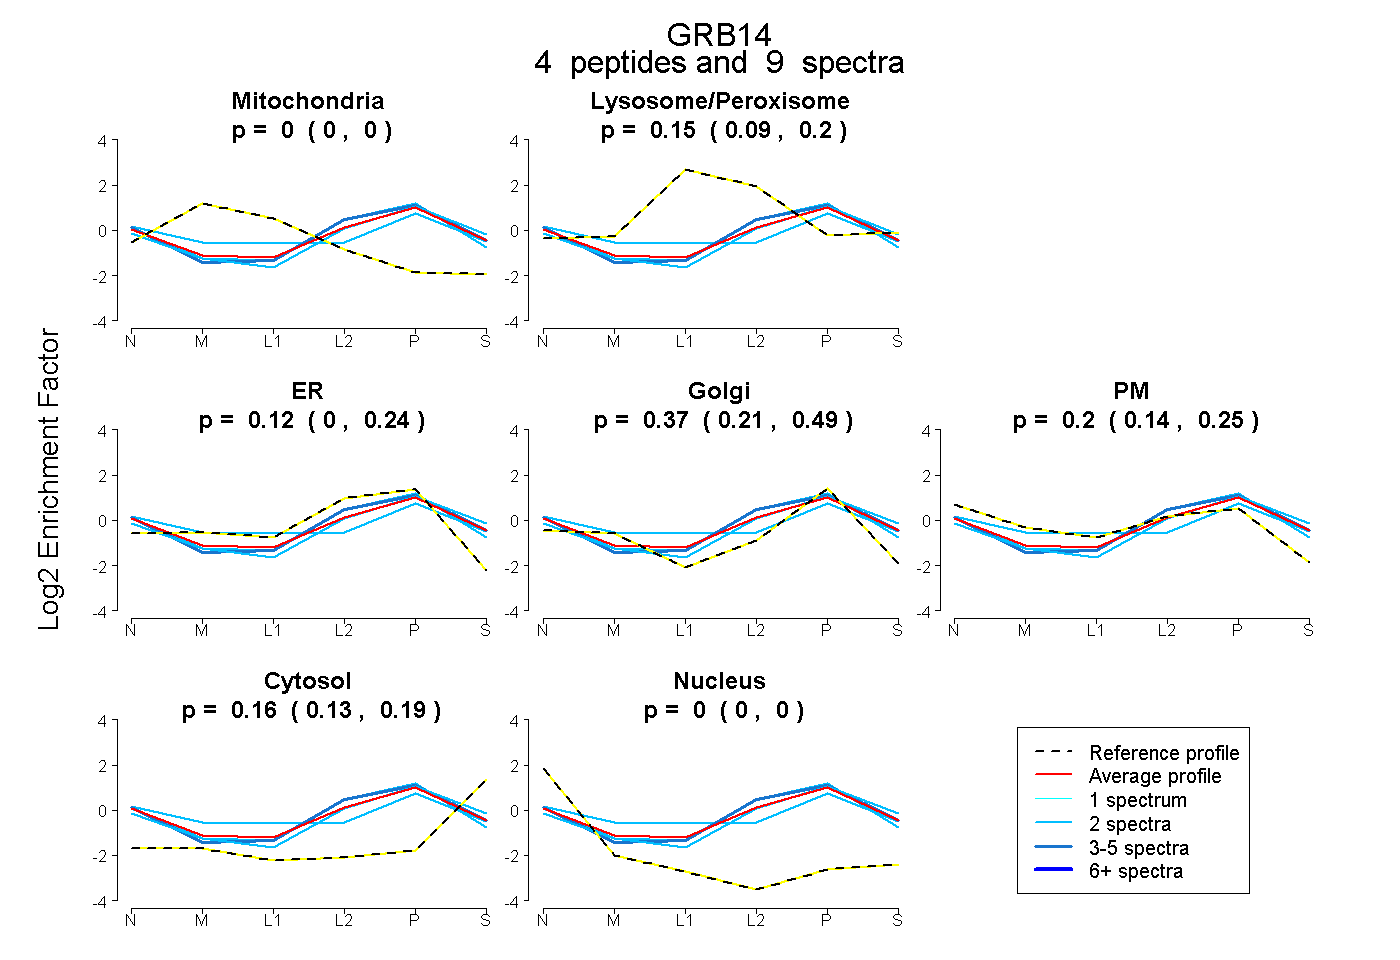 |
0.000 0.000 | 0.000 |
0.154 0.085 | 0.203 |
0.118 0.000 | 0.241 |
0.370 0.207 | 0.491 |
0.198 0.143 | 0.245 |
0.160 0.127 | 0.190 |
0.000 0.000 | 0.000 |
|||
| Plot | Lyso | Other | |||||||||||
| Expt C |
7 peptides |
24 spectra |
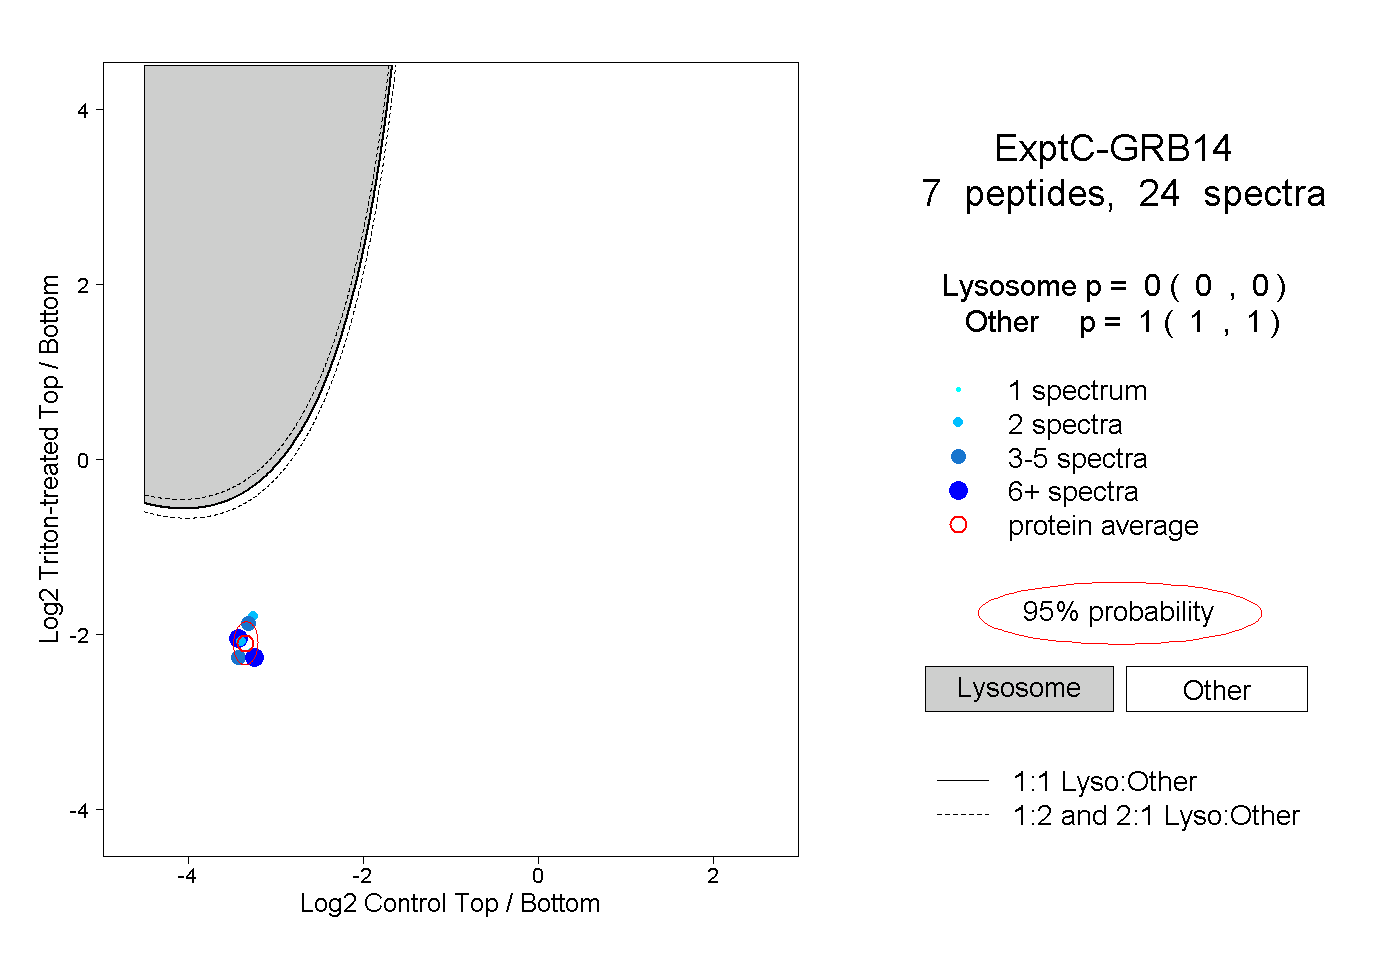 |
0.000 0.000 | 0.000 |
1.000 1.000 | 1.000 |
||||||||
| Plot | Lyso | Other | |||||||||||
| Expt D |
3 peptides |
7 spectra |
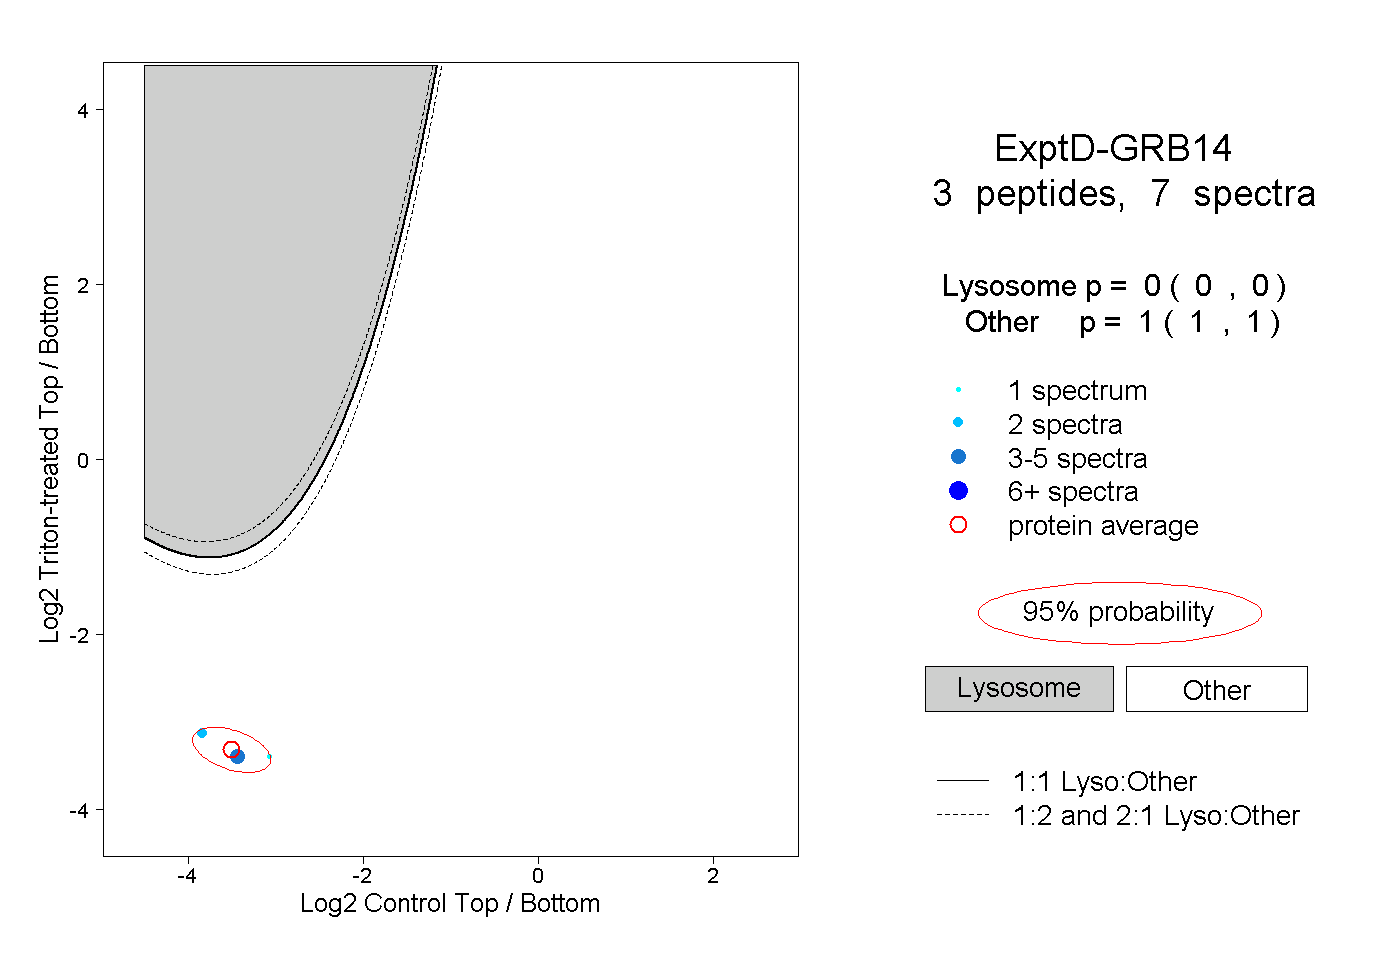 |
0.000 0.000 | 0.000 |
1.000 1.000 | 1.000 |