 5
5peptides
spectra
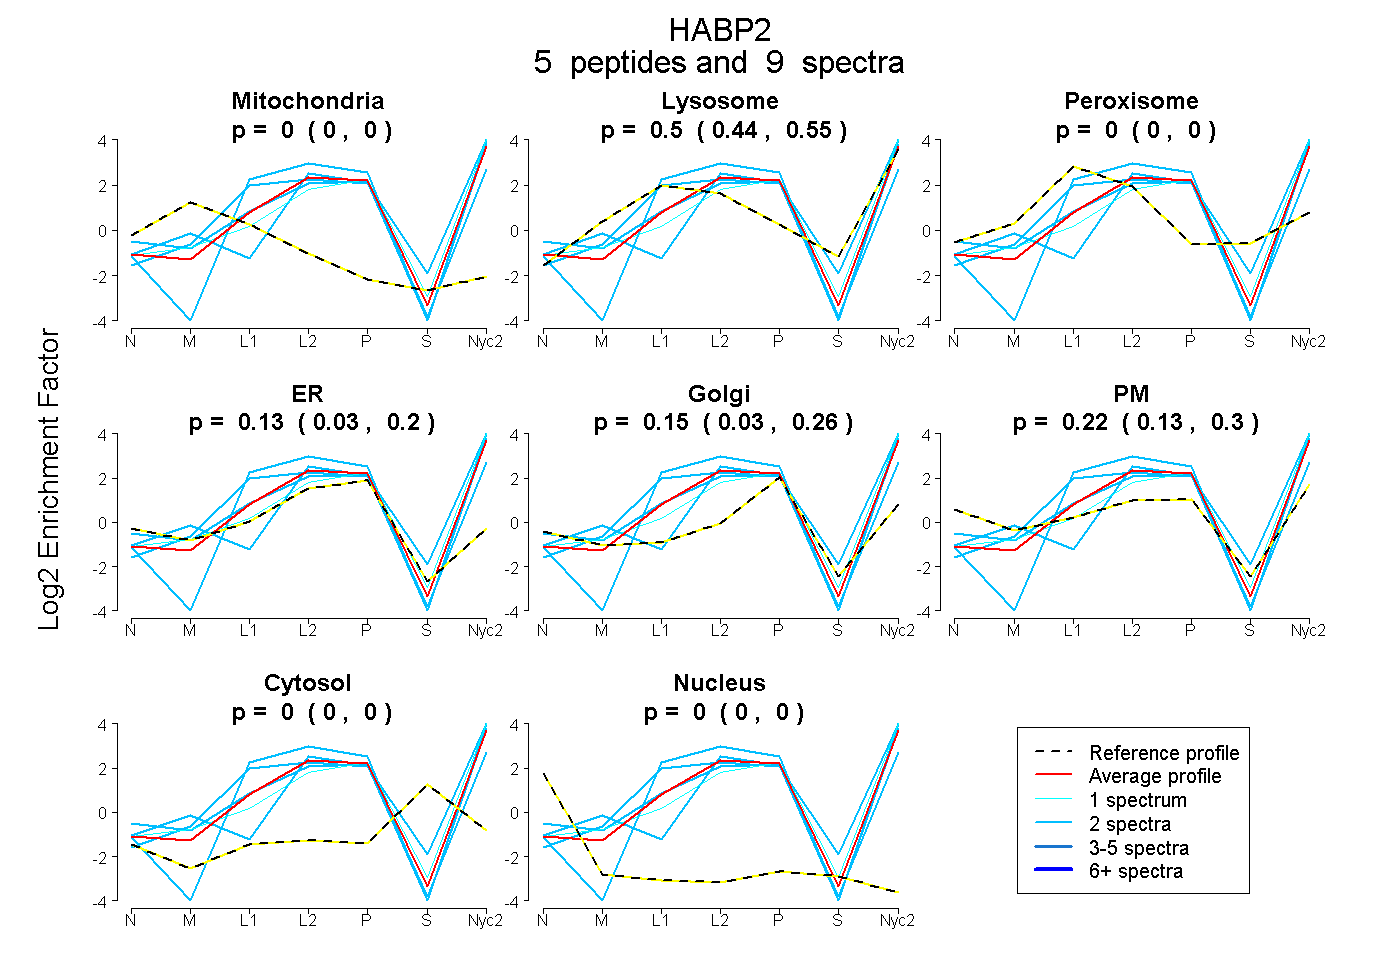
0.000 | 0.000
0.436 | 0.550
0.000 | 0.000
0.035 | 0.204
0.030 | 0.260
0.133 | 0.303
0.000 | 0.000
0.000 | 0.000
2peptides
spectra
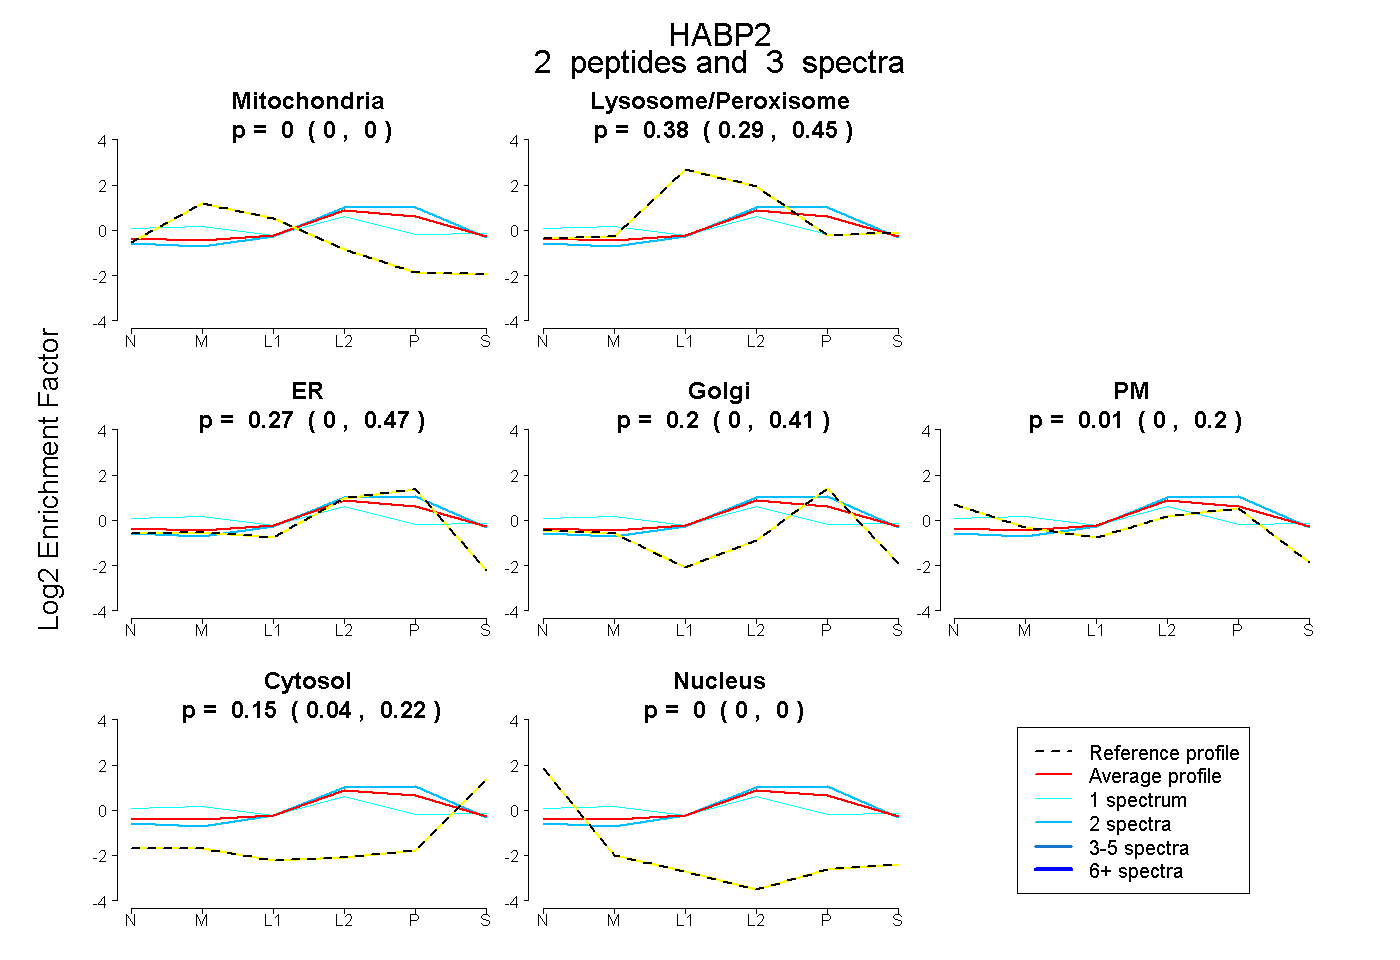
0.000 | 0.000
0.287 | 0.447
0.000 | 0.466
0.000 | 0.415
0.000 | 0.204
0.043 | 0.223
0.000 | 0.000
10peptides
spectra
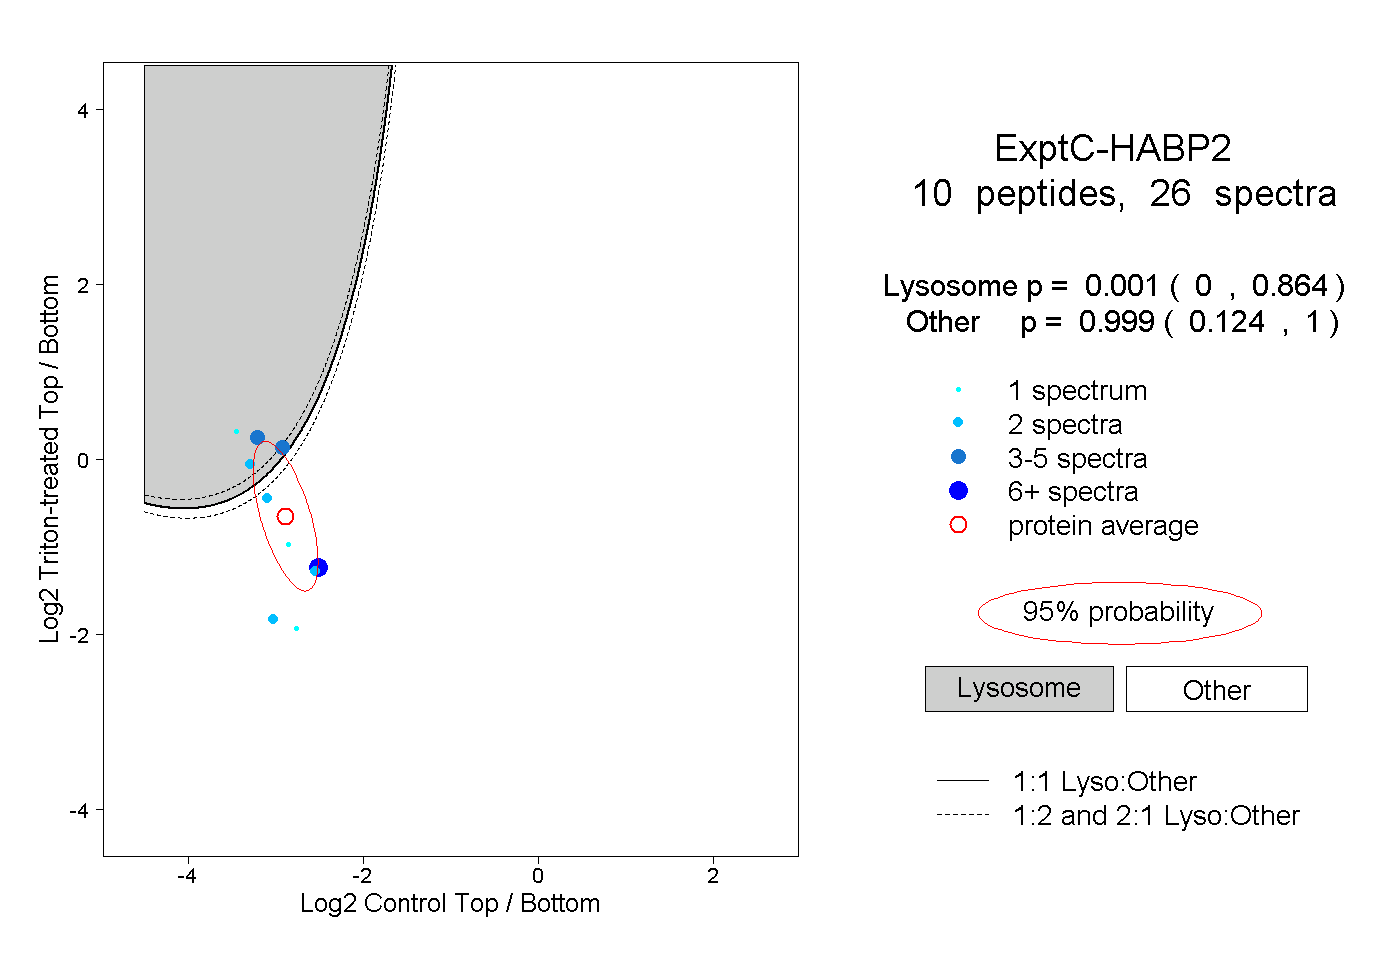
0.000 | 0.864
0.124 | 1.000
1peptide
spectrum
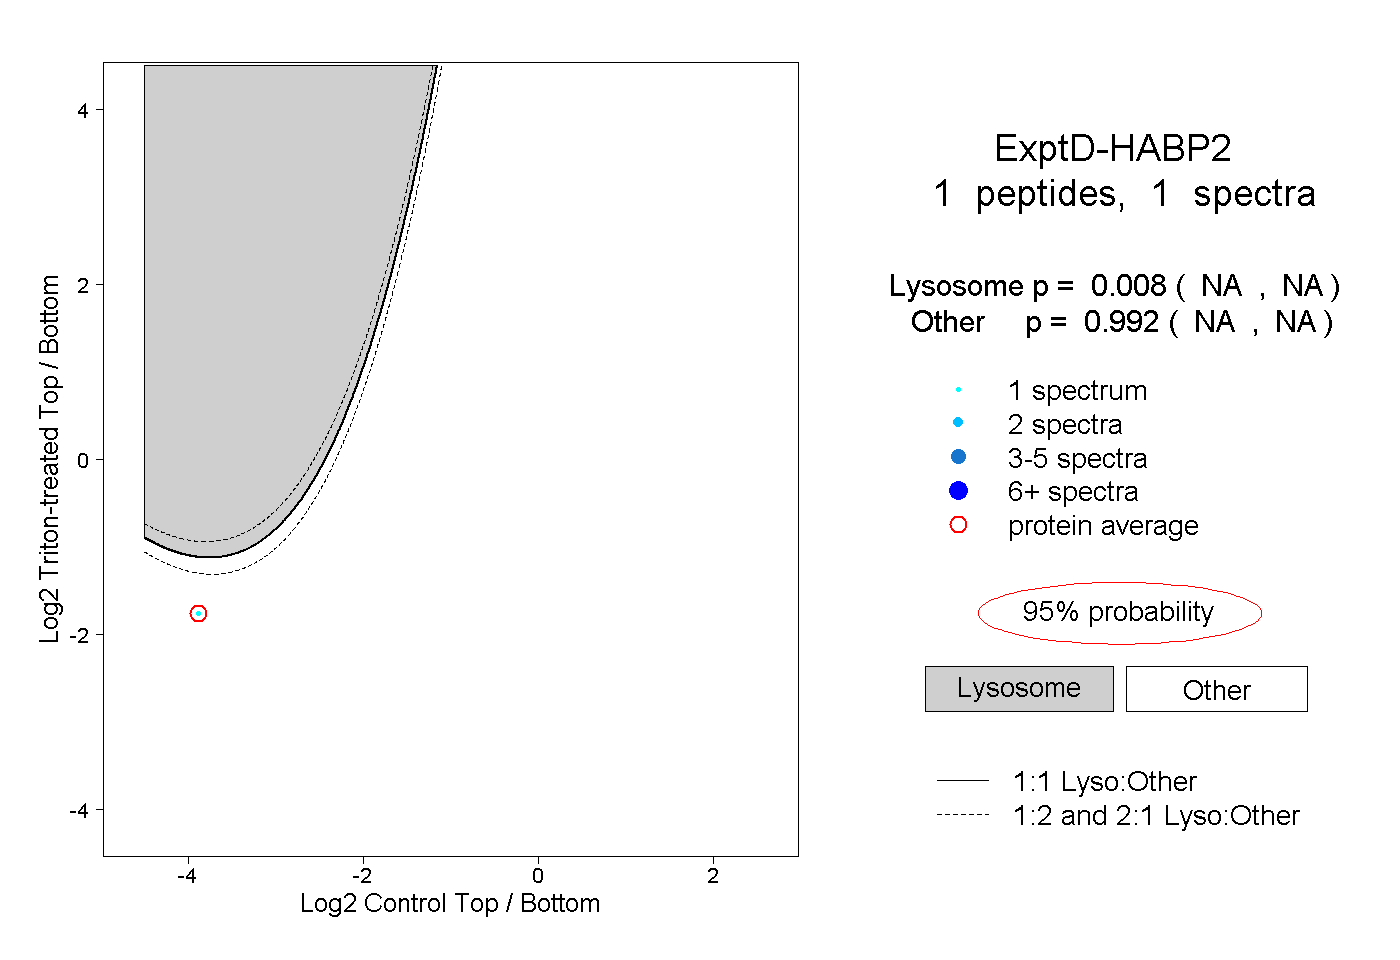
NA | NA
NA | NA